Fire Fighting

Emergency Response: Fire Fighting
Overview
Our client is a start-up company in the field of emergency response. It works with a wide range of provincial and municipal government agencies to take advantage of the rich data collected and put them into good use, turning raw data into an effective tool for decision makers.
Currently, data of several years are stored in stacks of Excel spreadsheets. Their usage is limited and persons-in-charge don’t get the insight that can help them make informed decisions when they need it.
This project is to help improve reporting and analysis capacities for city-level fire departments. The dashboards are expected to assist Fire Chief in responding better to emergencies by monitoring workloads and performance, and allocating resources to where most needed.
Building Data Pipeline
MongoDB > ODBC Data Sources > Power Query > Power BI Desktop > Power BI Service
Data are retrieved and stored in MongoDB. I used the ODBC (Open Database Connectivity) as the database API to access the data in MongoDB and connect it to Power BI.
All the datetime columns in the database are stored in Zulu time, hence it’s required to convert them to ET time. I used function tz_convert in Pandas library that gracefully handles this conversion and also takes care of the Daylight Saving Time issue.
1
2
3
4
import pandas as pd

dataset['Date'] = (pd.to_datetime(dataset.Date), errors='coerce')
dataset['Date_EST'] = dataset['Date'].dt.tz_convert('US/Eastern').dt.strftime("%Y-%m-%dT%H:%M:%S")
The script returns a table with undefined data type. Here it’s important to change the data type to datatime in the format that Power BI understands by using the following code:
1
2
# change the text data type back to datetime format that Power BI understands
DateTime.FromText([Date_EST], [Format="yyyy-MM-dd'T'HH:mm:ss"])
The dataset is then published to Power BI Service and used as a Power BI dataset that can be shared across departments. As such everyone in the organization that needs data from the fire department will access a single source of truth.
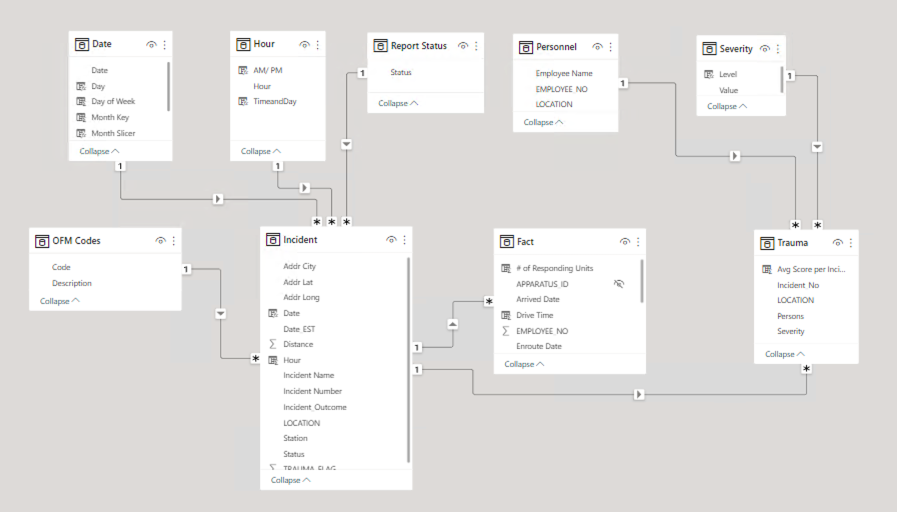
Below is the data modelling:
Defining KPIs
There are several metrics in this report, and many of them are heavily technical to fire fighters. Given the scope of this article, I will only review five key metrics as follows:
Number of dispatched incidents: total number of incidents that dispatchers assigned to apparatuses (fire trucks) to go to the sites.
Number of responded incidents: total number of dispatched incidents that apparatuses actually arrived at the sites. If the mission was cancelled while the apparatuses were on their way, it would not be counted.
Number of emergency incidents: total number of responded incidents that were classified as emergencies.
Percentage of achieving the 4-min target by apparatus: the percentage that first arriving units arrived at the sites of emergency incidents in 4 minutes or less by apparatus.
Percentage of achieving the 8-min target: the percentage that all units arrived at the sites of emergency incidents in 8 minutes or less if more than one unit were sent.
Developing Dashboards
Due to the restricted data privacy, the dashboards unfortunately are not yet available for public viewing.
Automating Process
Now users can use the dashboards to get the most updated information they care about within 24-hour or less. Data are retrieved and fetched into MongoDB within a timeframe of choice, and the Power BI dataset can be refreshed up to 8 times daily.
The project creates a sample showcase report for one city, and can be applied for other cities across Ontario.
Credits
Credit acknowledgement to Jake Espedido for the cover picture I used in this article.