Google Ads
Digital Marketing: Google Ads
Overview
Digital ads is supposed to be cheap. However, it can get very expensive if done incorrectly. Targeting the wrong audience leads to a low conversion rate, which in turn forces the business to spread its total acquisition costs over only a handful number of customers.
My client is an edutech company. It hires a marketing agency to help plan and execute its digital marketing campaigns in Google Ads. Google Ads (GA) dashboard helps my client track the performance of their campaigns in bringing users to its website and convert there.
However, the CEO is unsatisfied with the GA dashboard. It doesn’t give him an overall picture at the organizational level instead of campaign level he’s looking for, nor it allows him to drill into more dimensions and do his own analysis. He needs a better dashboard that can tell him if the marketing agency is doing their job.
In this project, I created an interactive dashboard in Metabase, the client’s BI environment, that is customized to the needs of their end users: the CEO and program managers.
Building Data Pipeline
To provide some background to those who are unfamiliar with Google Ads’s design, Google Ads structures data in three levels: user, campaigns, and ad groups.
User: a unique Google Ads account associated with a unique email address, password, and billing information.
Campaigns: under a user, several campaigns can be created. A campaign is a set of ad groups (ads, keywords, and bids) that share a budget, location targeting, and other settings. Depending on the marketing goals, such as driving online leads and sales, making people aware of your brand or considering your product, a campaign type will be chosen accordingly. For instance, in this project, the marketing goal was to boost online leads, hence it used search campaigns heavily.
Ad groups: an ad group contains one or more ads that share similar targets. A keyword list is chosen in each ad group to tell Google Ads to show ads for these services only on websites related to them.
Data from Google Ads is ETL-ed daily by Airbyte to Metabase. Metabase is an integrated tool that stores data, provides console to write SQL queries, and create dashboard.
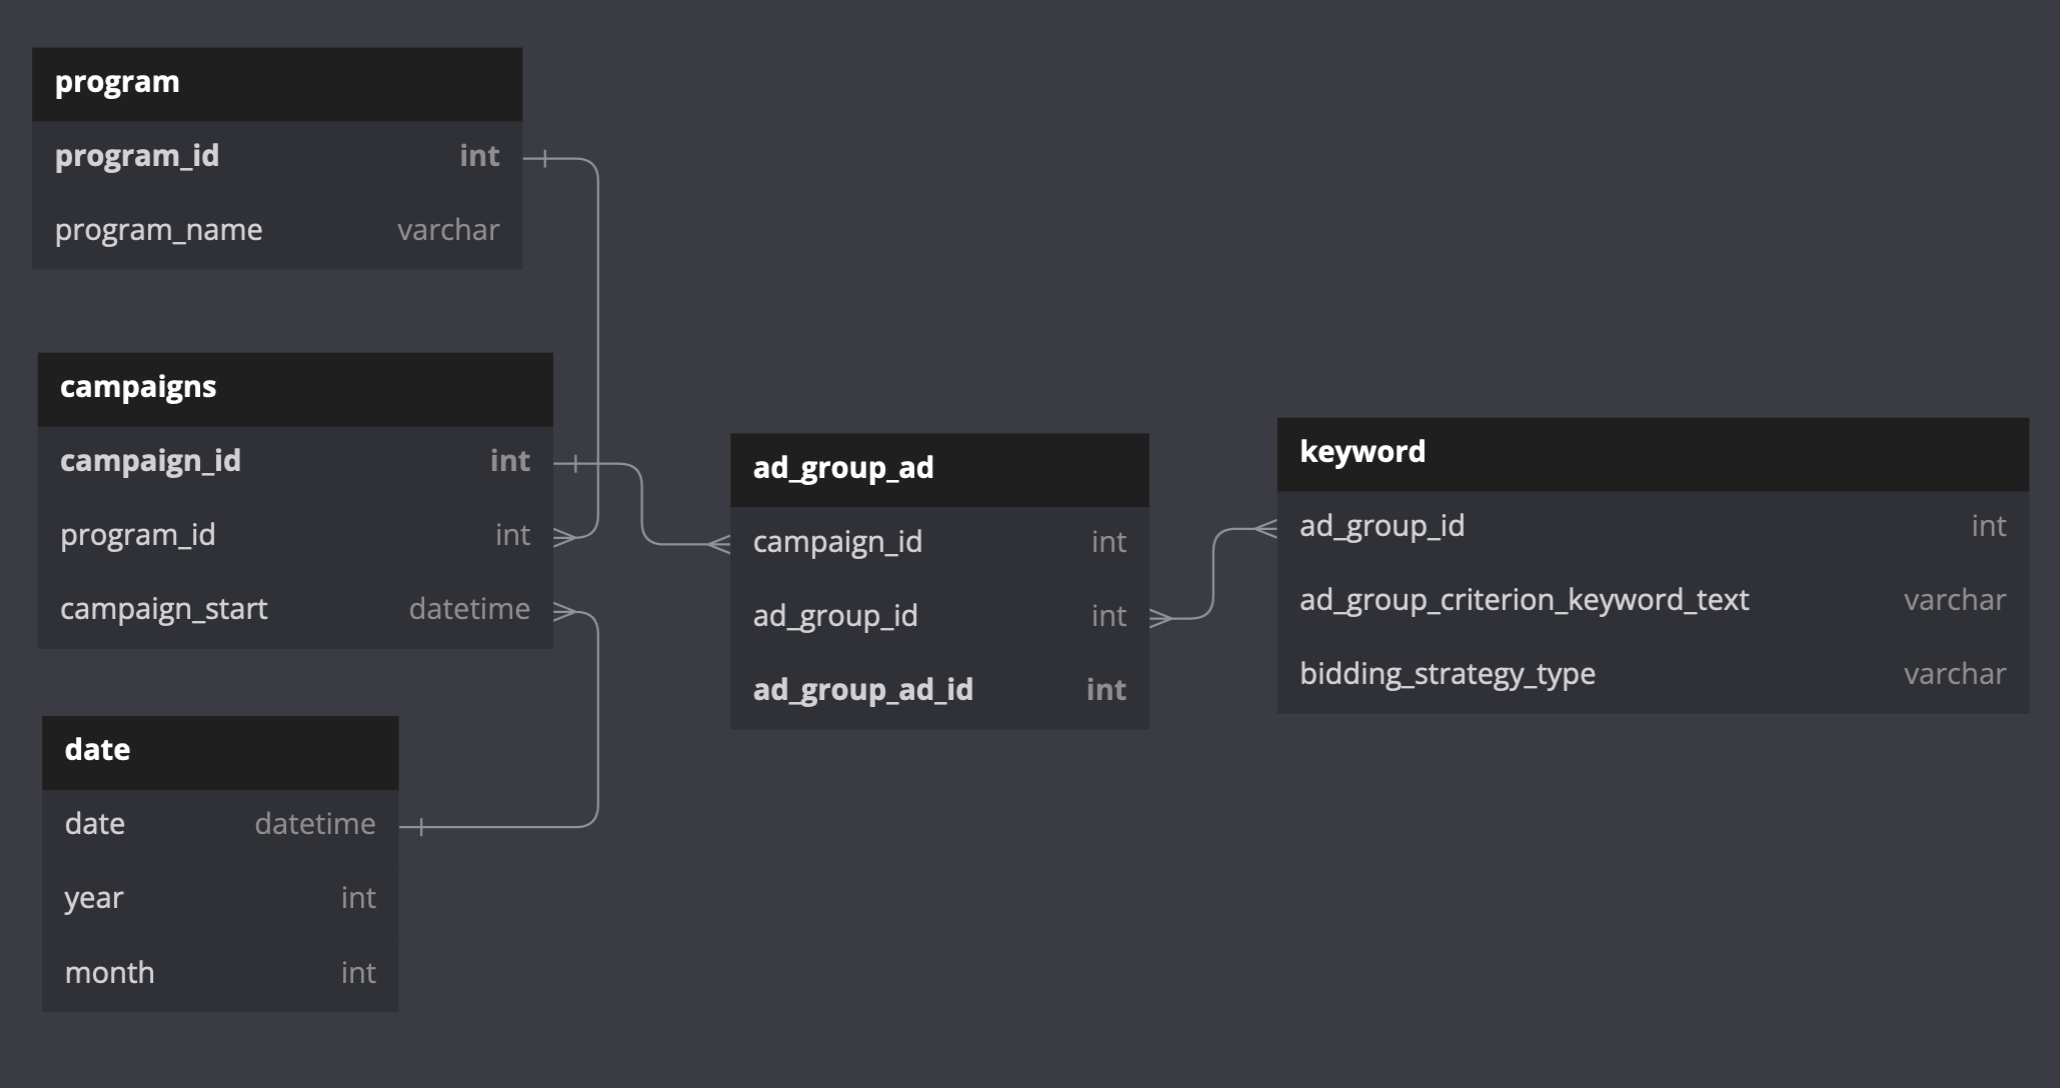
For the purpose of this project, I use three tables that contain attributes relating to campaign, ads and keywords. I write SQL queries to explore and wrangle data, collect metrics of interests from the three tables.
Data Modelling of the Dashboard
Defining KPIs
- conversions (leads): defined as when an user visits the website and fills in the form.
- cost: charged by number of clicks.
- cost per conversion (cpa) = total amount of cost / number of conversions.
- clicks: defined as the number of times users clicked on the ads shown to them.
- cost per click (cpc) = number of cost / number of clicks
- clickthrough rate (%) = number of clicks / number of impressions * 100. Impression is defined as the number of times when an ad is shown to users.
- conversion per click rate (%) = number of conversions / number of clicks * 100
Developing Dashboards
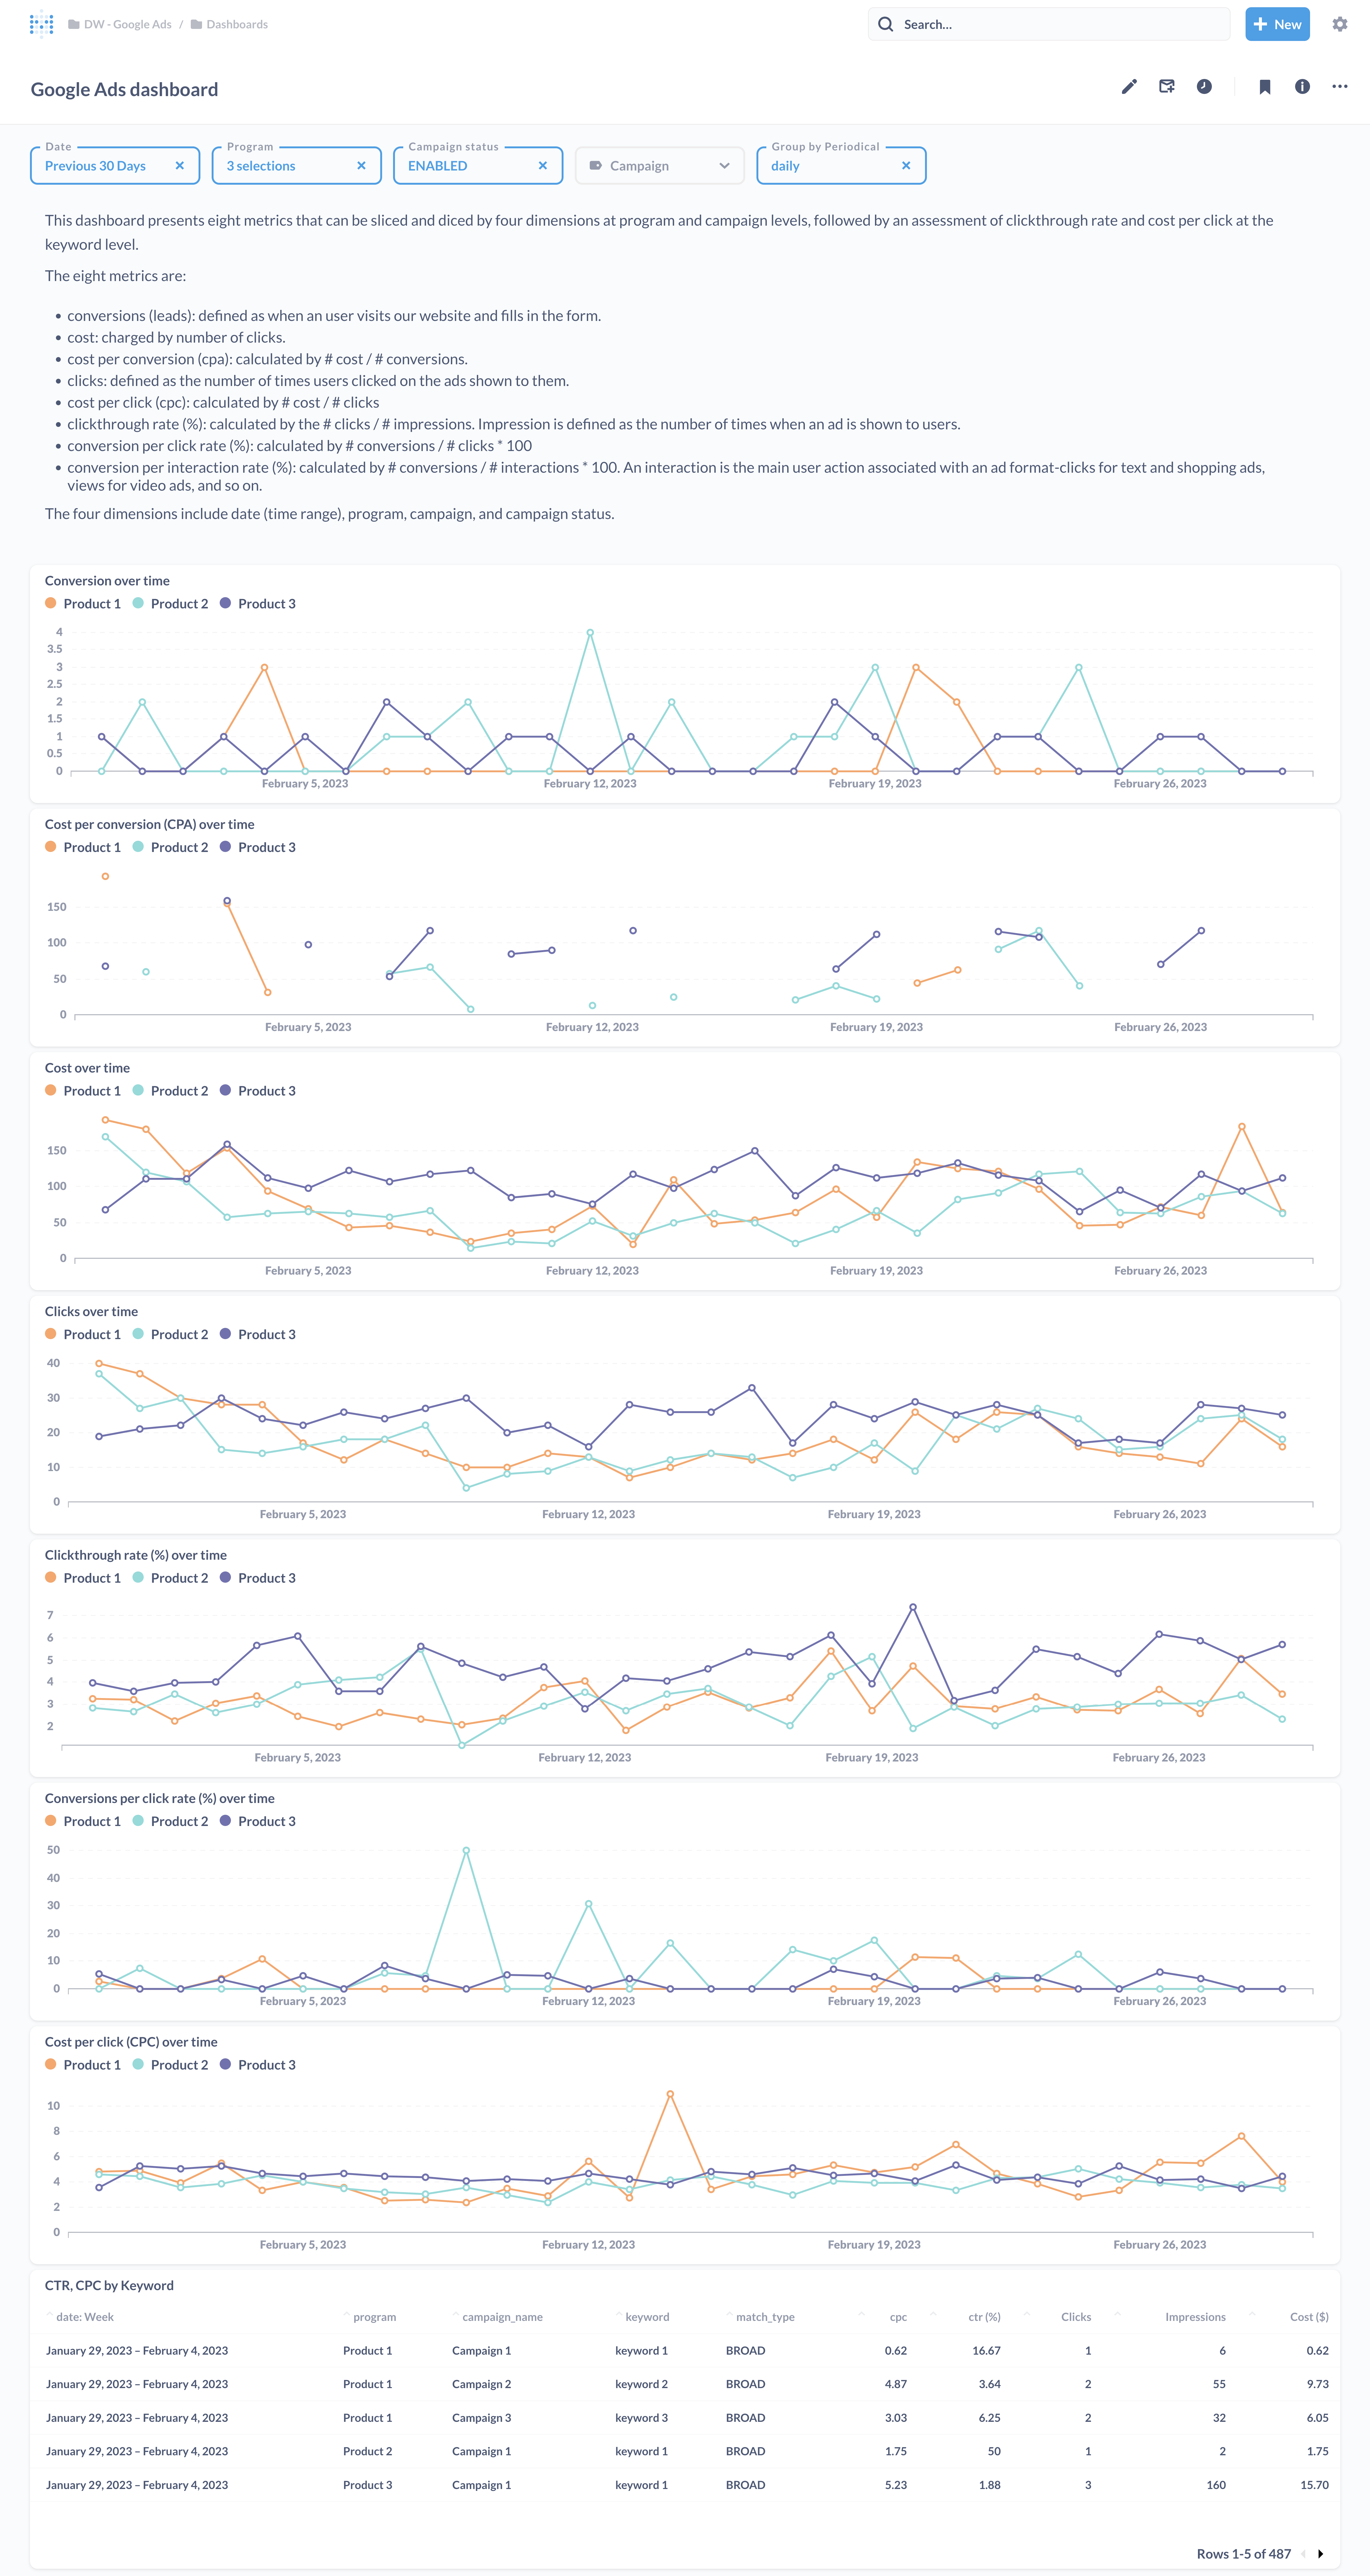
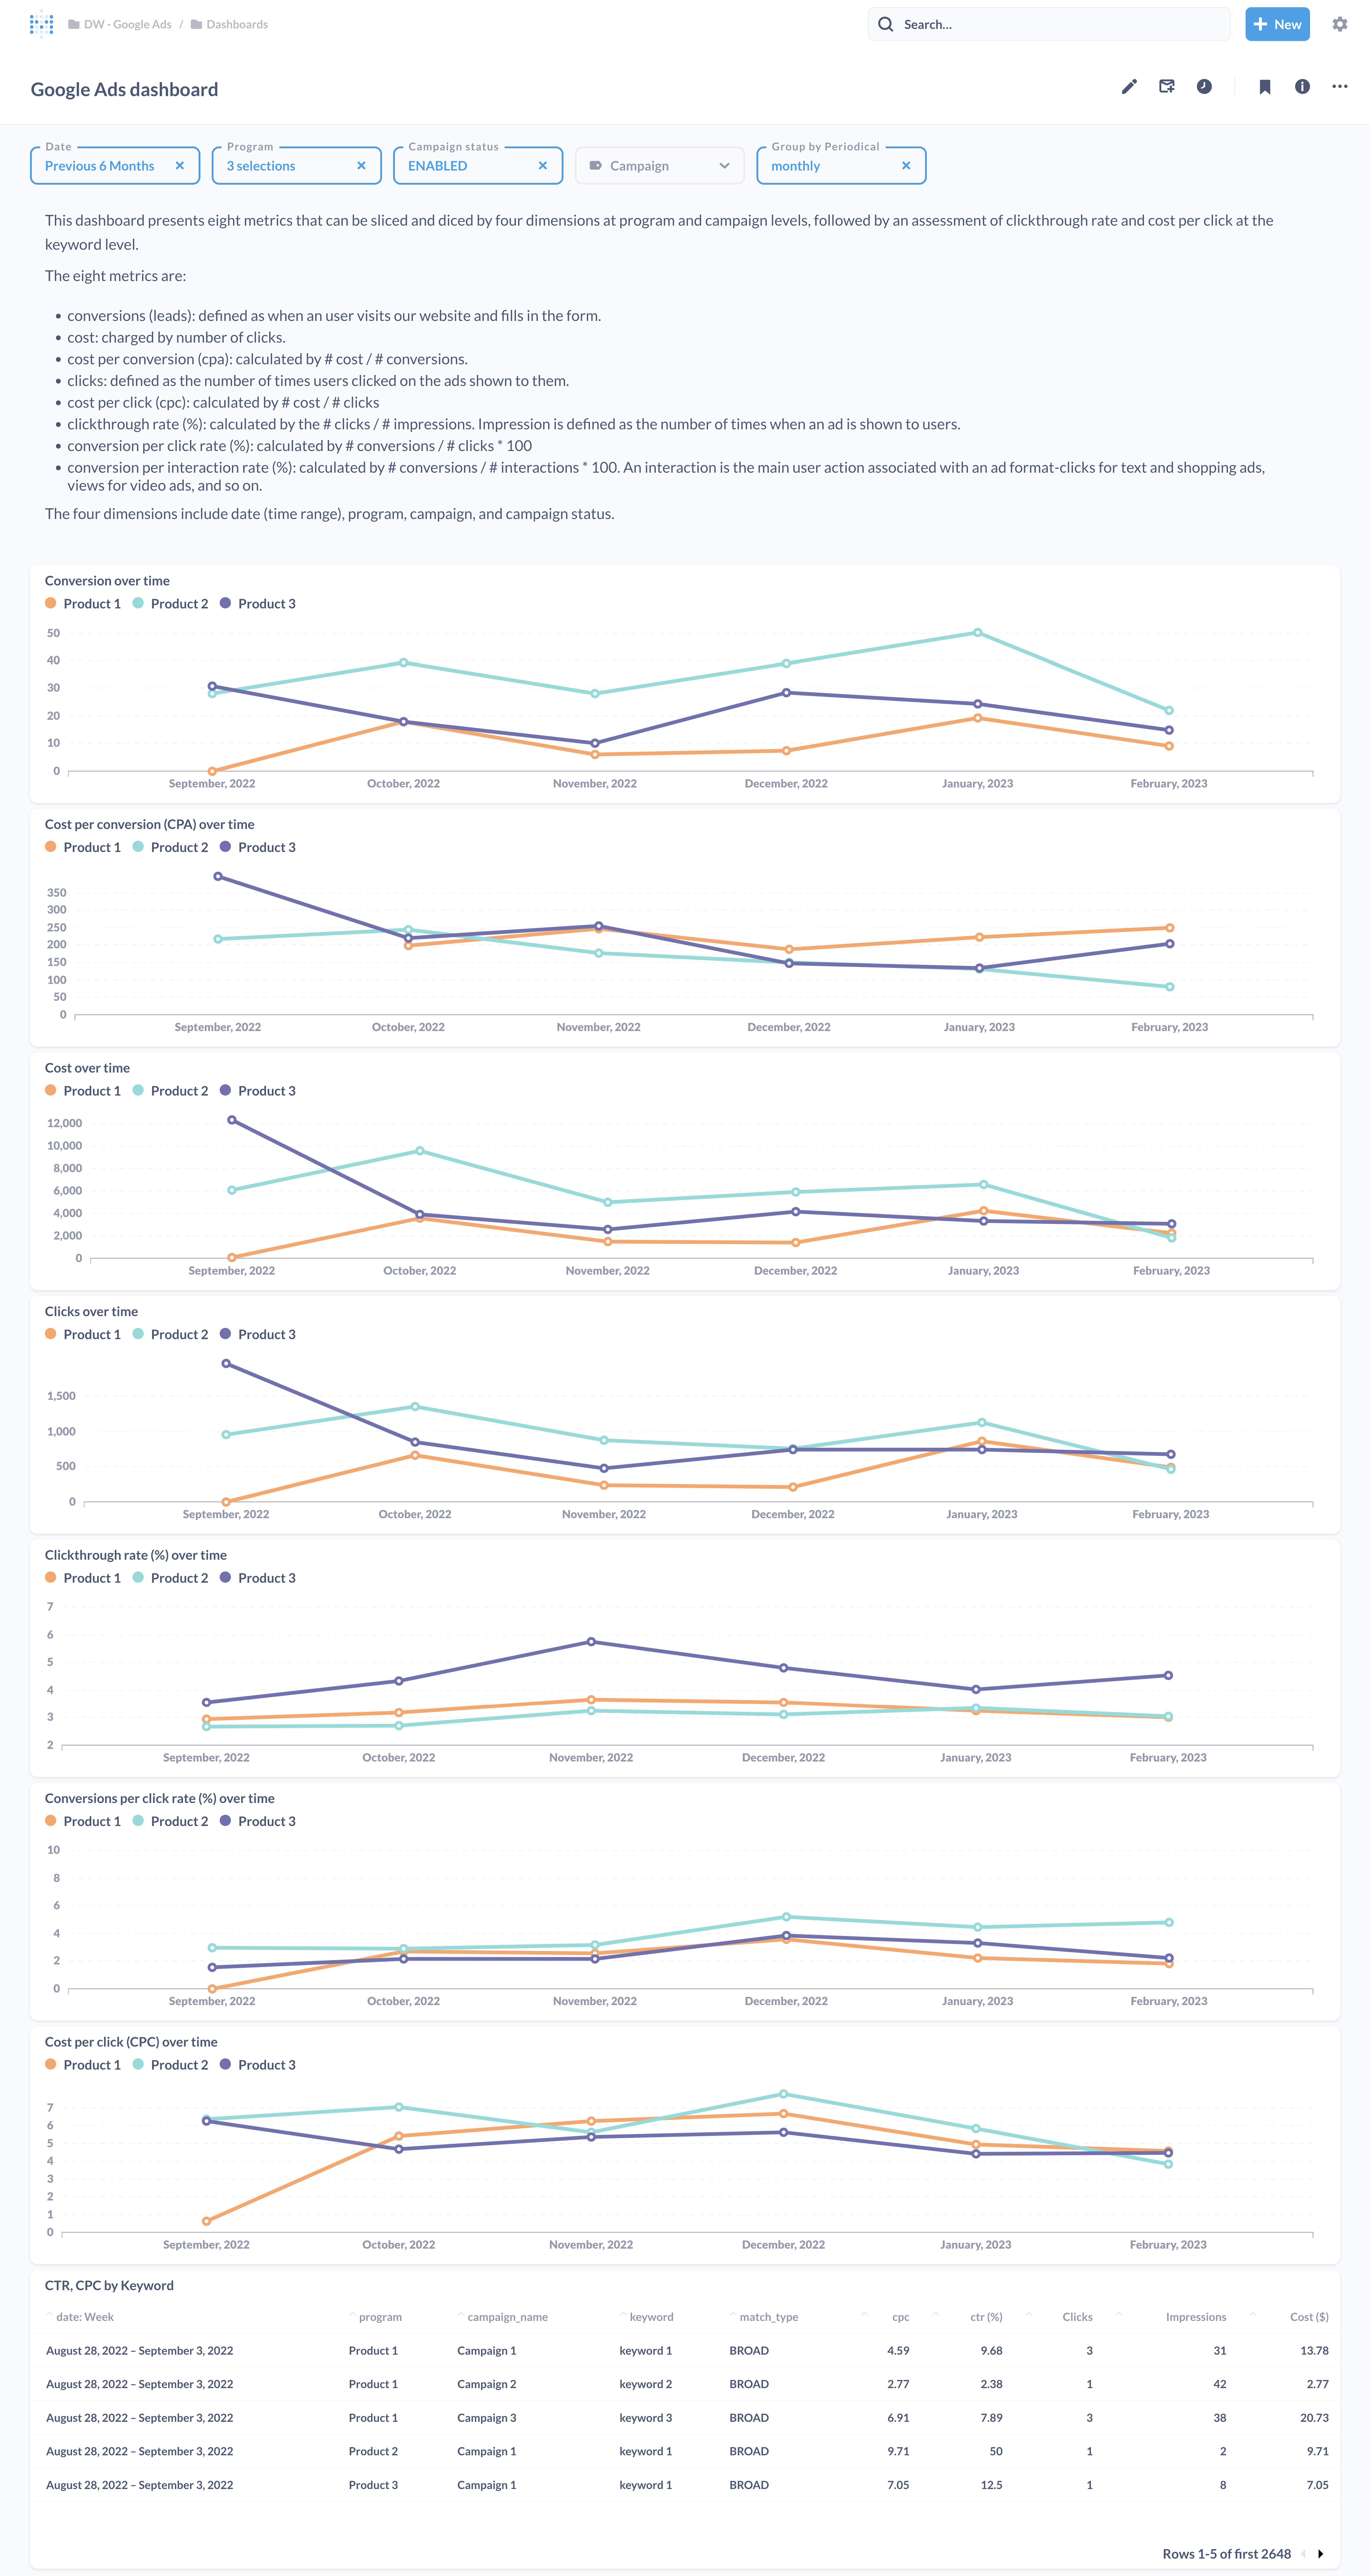
This dashboard presents eight metrics that can be sliced and diced by five dimensions: Date, Program, Campaign, Campaign Status, and Periodicals .
Periodicals allows users to choose the level of granularity, be it daily, weekly, monthly, quarterly, or yearly within a date range. For instance, users can choose to look at the performance in the last 30 days at the daily level (left hand side screenshot), or performance in the last 6 months at the monthly level (right hand side screenshot).
Dashboard in last 30 days, granularity: day
Dashboard in last 6 months, granularity: month
Automating Process
Technically speaking, this project is only a starting point in bringing Google Ads analysis in-house. The dashboard was created on the fly from several SQL queries to meet the urgent needs of business users. Even though the dashboard will be automatically updated when getting new data, its performance will start to suffer at some point since more data are coming quickly and regularly on a daily basis. As such, the next step is to work on performance tuning from the backend to improve the speed. This task requires a close collaboration between data analysts and data engineers.
Business speaking, monitoring the performance of digital ads is only a part of the story. Businesses need to combine it with data from their websites to get a complete understanding of the attribution model of their businesses. An example of working with Google Analytics to extract website data at a raw, granular level for in-house analysis can be found here.
Credits
Credit acknowledgement to those whose property I used in this article:
Cover picture by Melanie Deziel
Icon picture by Mary Amato


