Mega Store

Retail Industry: Mega Store
Overview
Contoso is a fictional global retailer of 3C (computer, communication and consumer electronics) products with three years of sample sales data. Its goal is to accelerate digital transformation and bring together its employees, partners, data, and processes to create customer value and maintain its competitive advantage in a digital-first world.
In this project, I used the Contoso dataset to create an executive-level report to present in a shareholder meeting. It is to inform and analyze financial statement KPIs that shareholders care the most, from top line sales to bottom line profit.
I updated the date range in the dataset from 2007-2009 to 2020-2022 to make the report look more recent, and called it the Mega Store Dashboards. Access to SQL script here.
Building Data Pipeline
ContosoBIdemoBAK.exe > SQL Server Management Studio > Power BI
The dataset Microsoft Contoso BI Demo Dataset for Retail Industry can be downloaded from Microsoft’s website. It contains 26 tables, and is 1.34 GB in size. The biggest table contains more than 10 million records.
For the purpose of this project, I used 14 tables, each relates to the other(s) as illustrated in the Entity Relationship Diagram below.
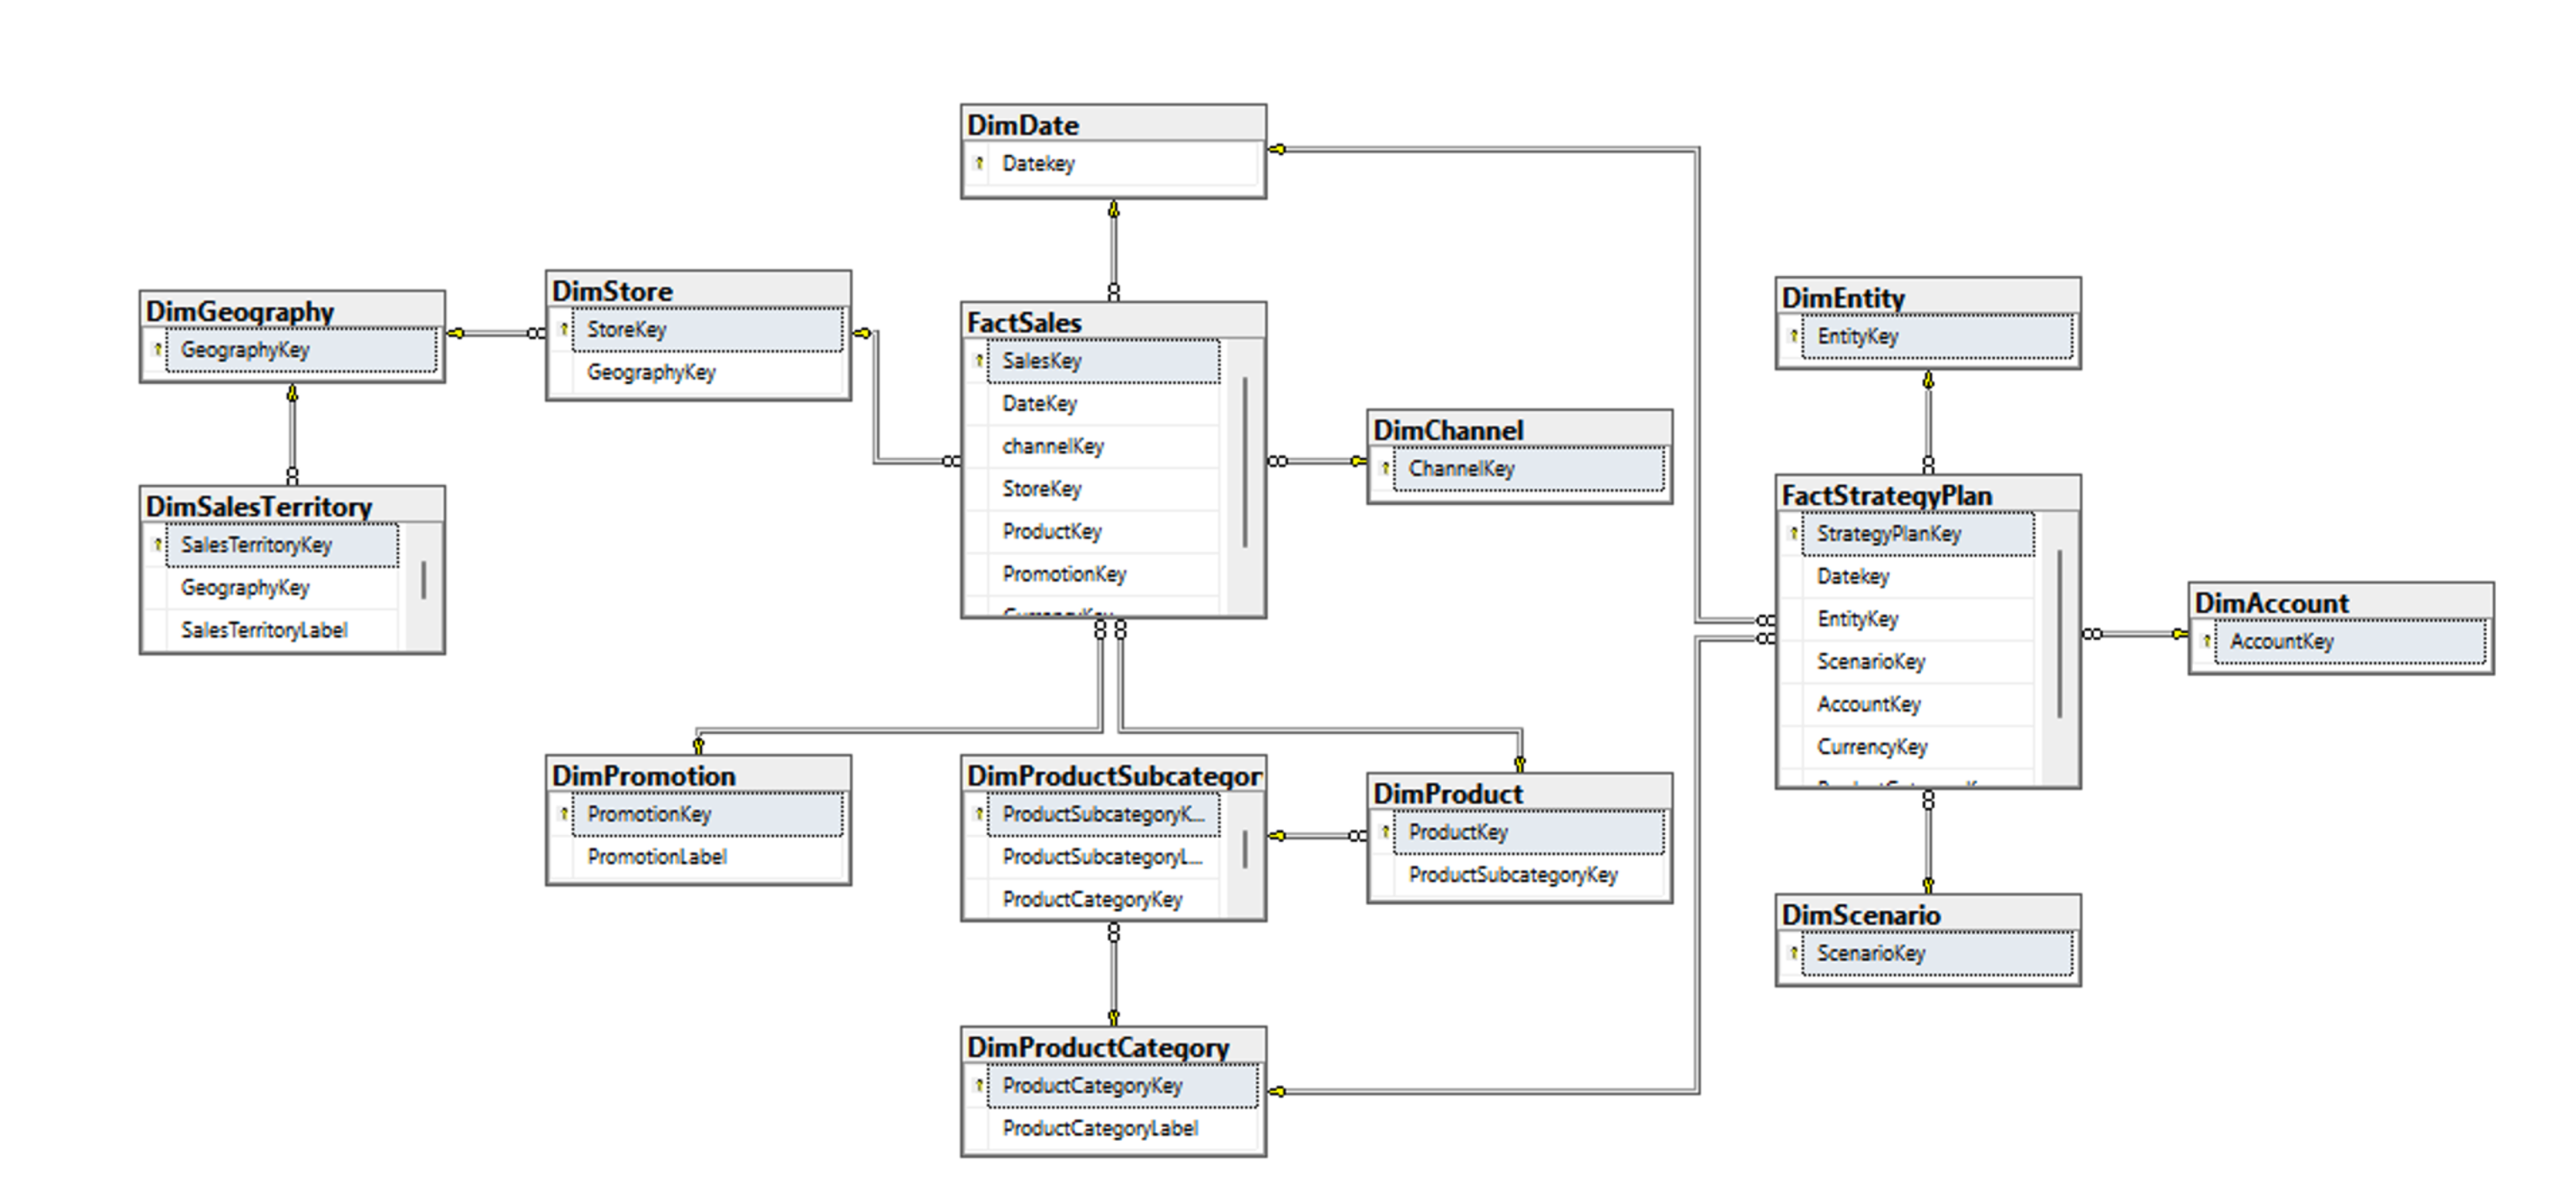
Entity Relationship Diagram of the original dataset
I set up SQL Server and used SQL Server Management Studio to write SQL script to explore, wrangle, and manipulate the data. Notably,
I appended the Quadrant column into FactSales table and created a View_Sales table.
I created a View_ProductLabel table that contain the data on transition of products among 4 quadrants. For instance, last year high-current year high, last year low-current year high, last year low - current year low.
Similarly, I created a View_StoreLabel table that contain the data on transition of stores among 4 quadrants.
Lastly, I created a View_City table that converts Geometry to Longitude and Latitude.
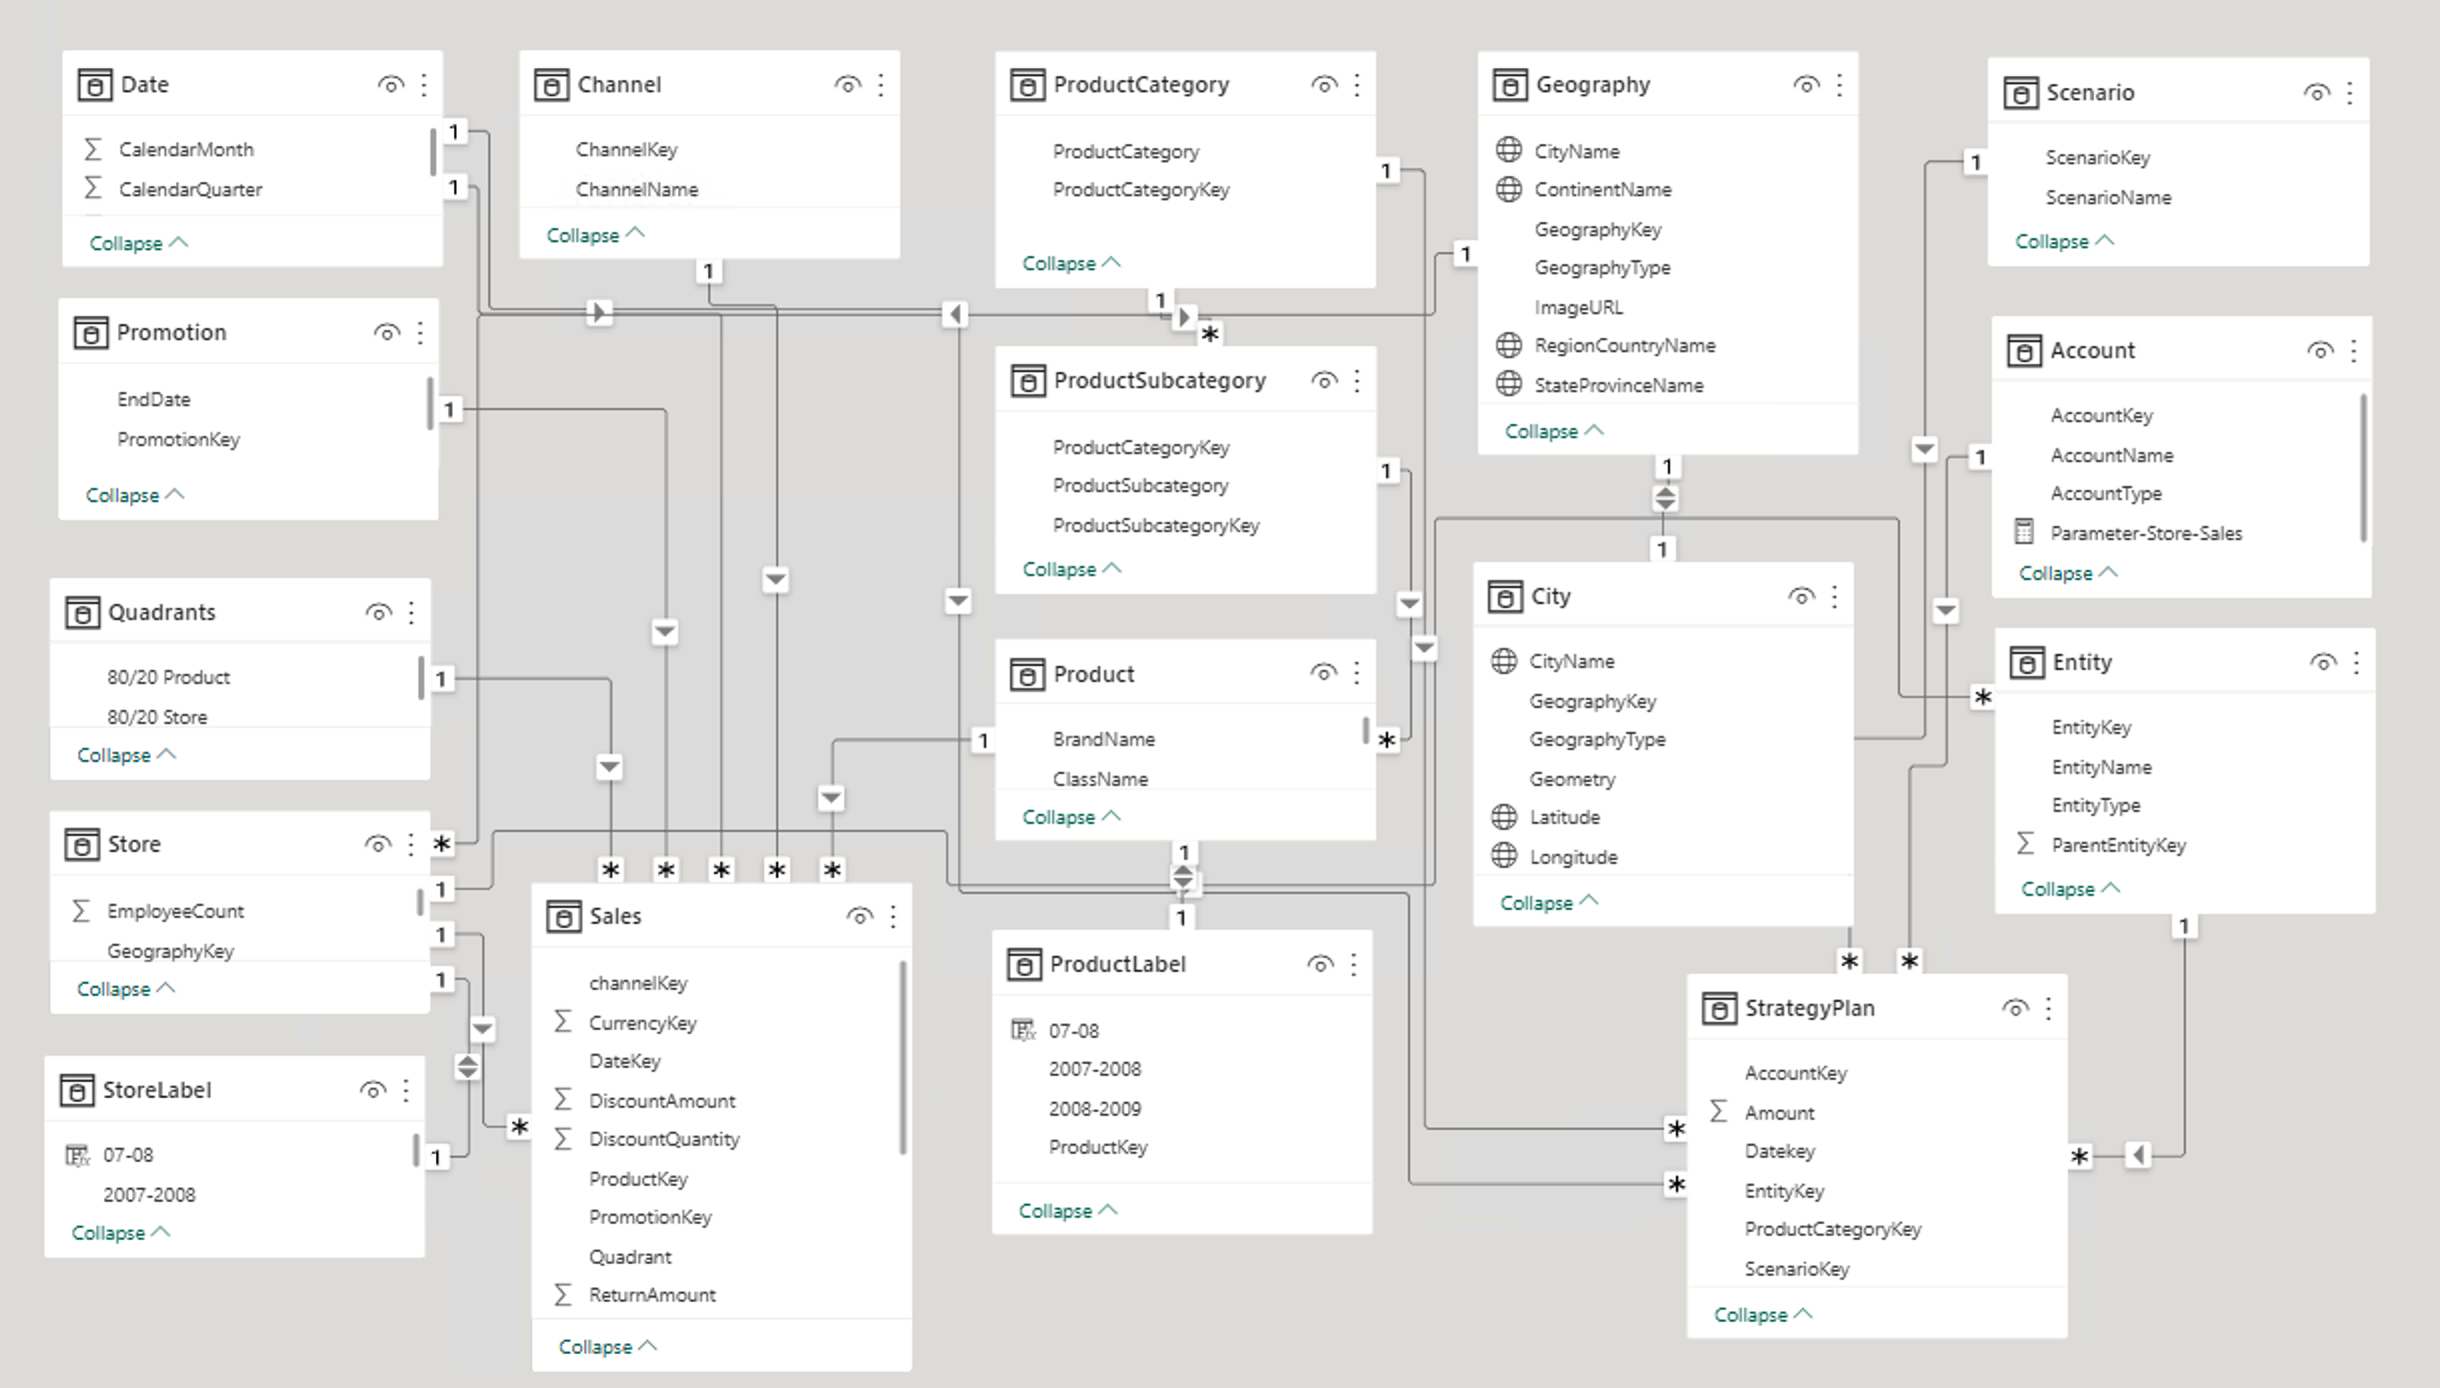
Once the data are wrangled and put into analyzable shape, they are loaded into Power BI. The data modelling is built as below.
Defining KPIs
There are more than 20 metrics in this report, hence it’s impossible to go over an exhaustive list given the scope of this article.
Instead, I will present key financial metrics I’ve reconciled, and some important concepts to provide a background for report comprehension.
Financial metrics
1
2
3
4
5
6
7
8
9
10
11
Discount% = DiscountAmount /  (UnitPrice * DiscountQuantity)
Return% = ReturnQuantity / SalesQuantity

SalesAmount = UnitPrice * SalesQuantity - DiscountAmount
ReturnAmount = UnitPrice * ReturnQuantity

NetSales = SalesAmount - ReturnAmount
TotalCost = UnitCost * (SalesQuantity - ReturnQuantity)

GrossProfit = NetSales - TotalCost
GrossMargin% = GrossProfit / NetSales
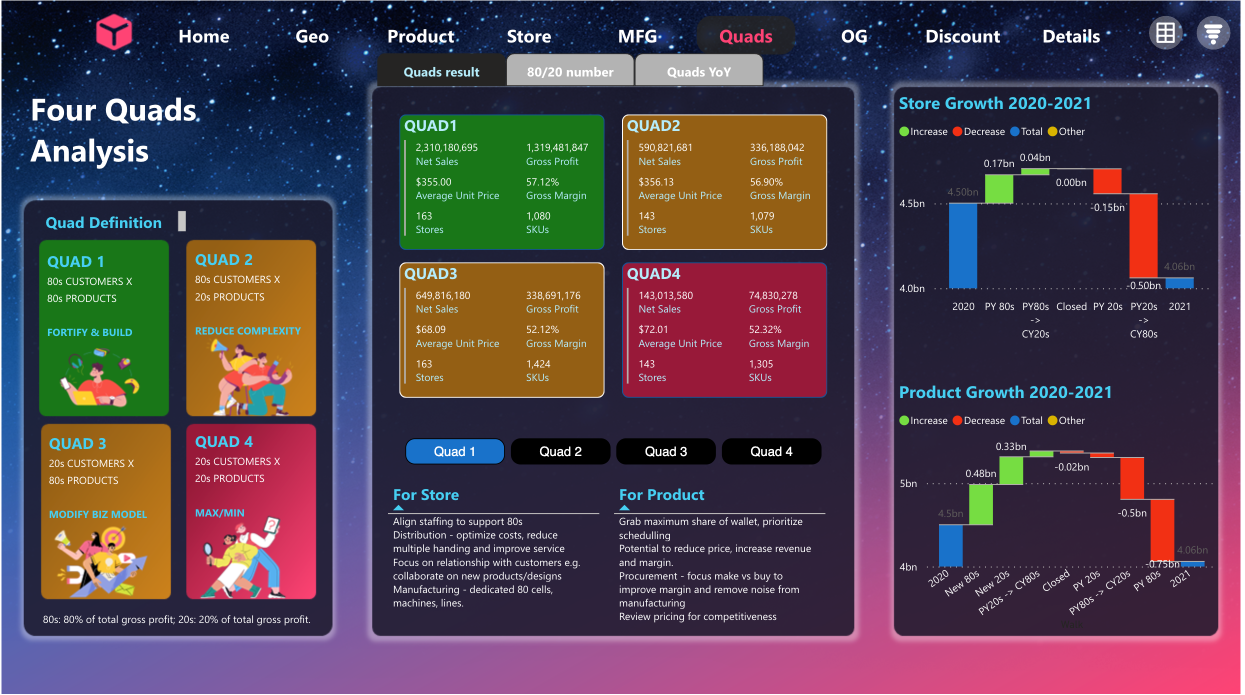
Quadrant analysis
Four-quadrant analysis is based on Pareto principle:
Find 20% products and stores that contribute to 80% sales and profit
Classify products and stores to 4 quadrants based on contribution: continue (high, high), improve (high low, low high), stop (low, low).
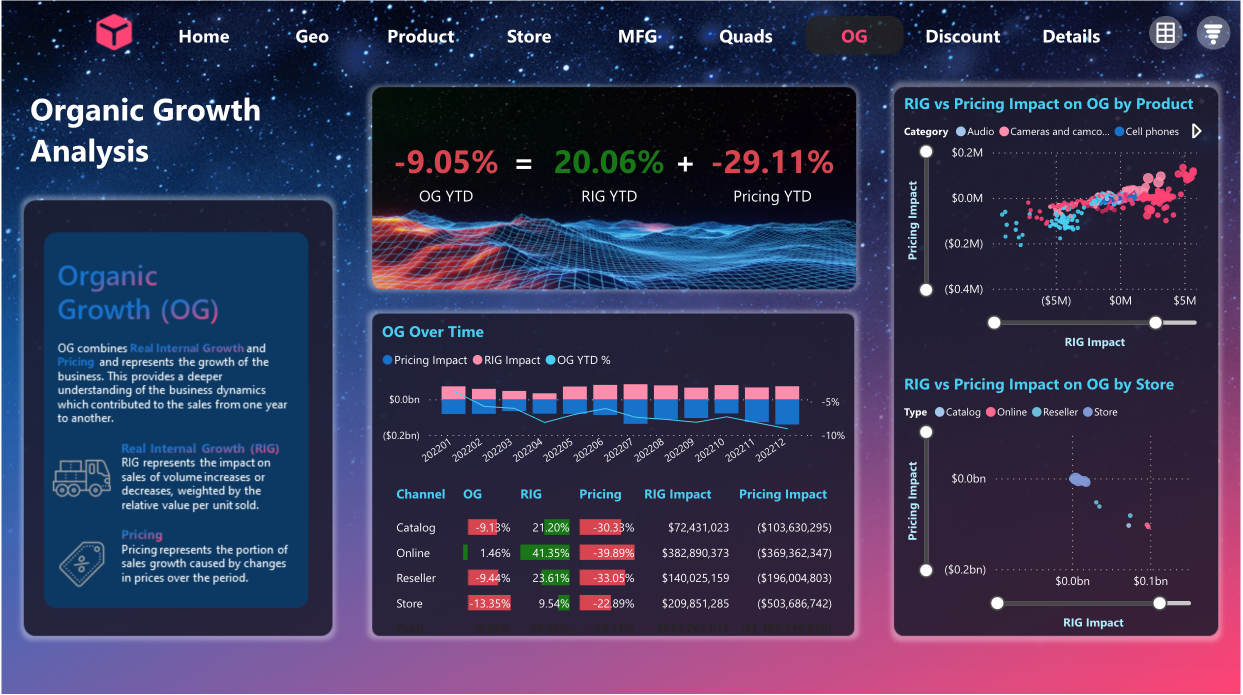
Organic Growth (OG): separate organic growth by volume impact (Real Internal Growth RIG) and pricing impact (Pricing), help product and pricing team to plan/execute marketing campaigns including discounts to achieve profitable growth.
1
2
3
4
5
6
7
8
9
10
11
12
13
S - Sales
V - Volume
P - Price
1 - Period 1
2 - Period 2
S = V x P
P = S / V
OG = S2 - S1 = (V2 - V1) x S1 / V1 + V2 x (S2 / V2 - S1 / V1)
RIG = (V2 - V1) x S1 / V1 = (V2 - V1) x P1 - due to volume change
Pricing = V2 x (S2 / V2 - S1 / V1) = V2 x (P2 - P1) - due to price change
OG % = (S2 - S1) / S1 = (V2 - V1) / V1 + (S2 / S1 - V2 / V1)
RIG % = (V2 - V1) / V1 - due to volume change
Pricing % = S2 / S1 - V2 / V1 - due to price change
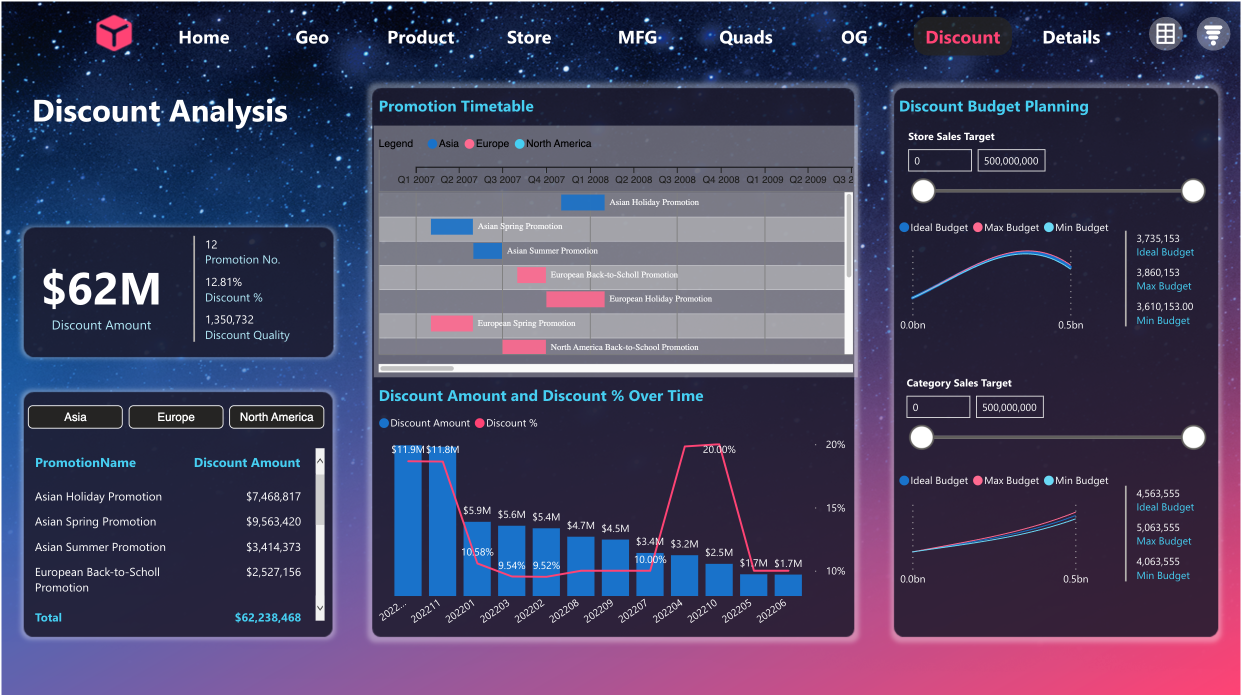
Discount Analysis: Regression analysis is used in discount budget analysis, regression fitting is performed based on historical discounts and sales data, and model parameters are obtained, intervals are provided in the chart for decision-making, and planning for future discount budget planning.
I used DAX Studio to write DAX queries to understand tabular model, and used Tabular Editor to write and edit DAX formula to test calculated columns (row context), measures (filter context), calculated tables (context transition).
Developing Dashboards
Design ideas come from Ready Player One (2018 sci-fi adventure film), cyberpunk games and pop culture.
Backgrounds are created by multi layer overlay, blue-and-red neon glow and semi-transparent container to size and position visuals.
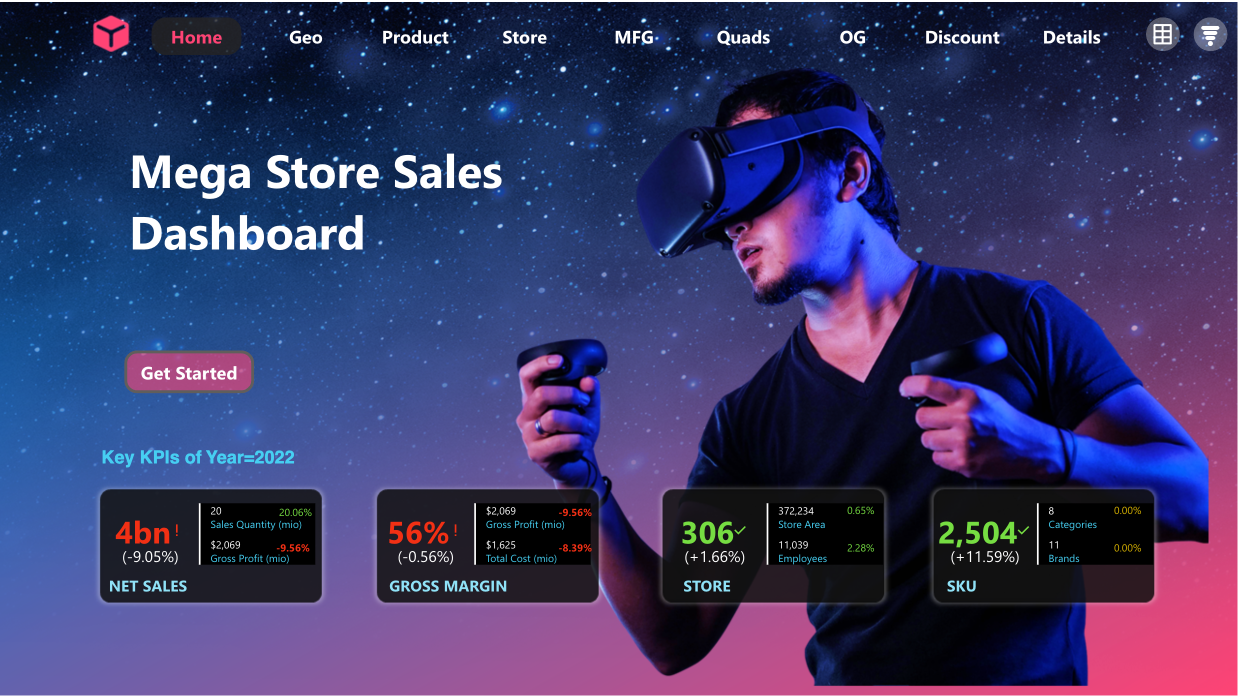
The report has seven pages:
- a
Homepage, - four pages of basic analysis (
Geo,Product,StoreandMFG(Manufacturer), - three pages of in-depth analysis (
Quads,OG(Organic Growth), andDiscount), and - one
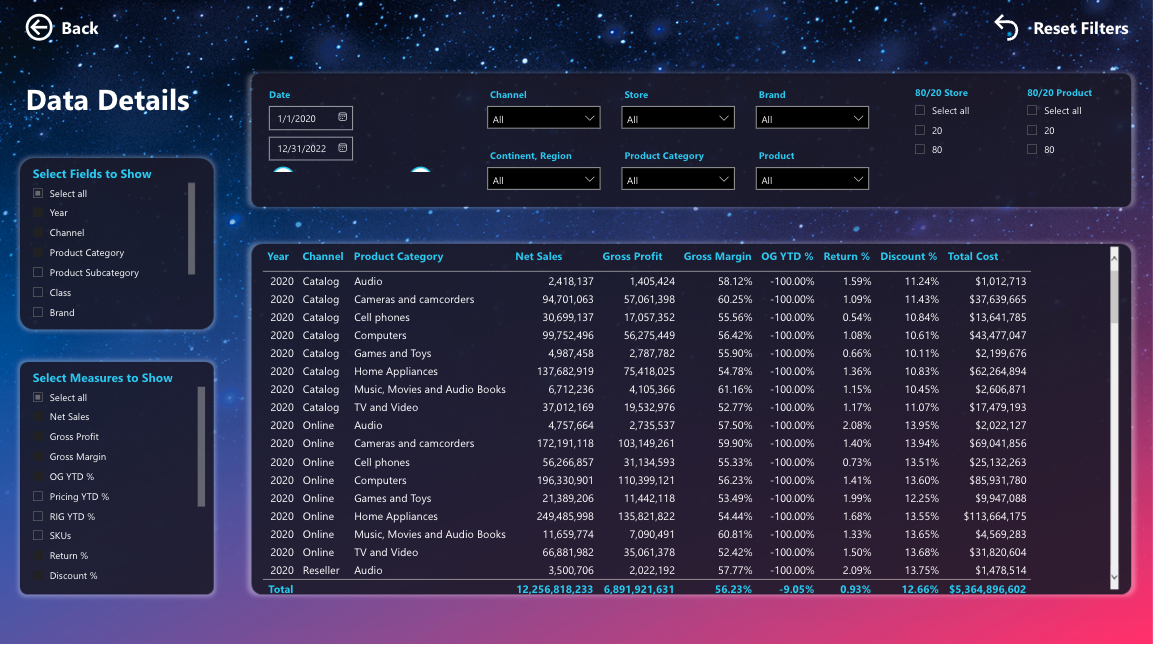
Detailpage that captures all key KPIs and dimensions in one place.
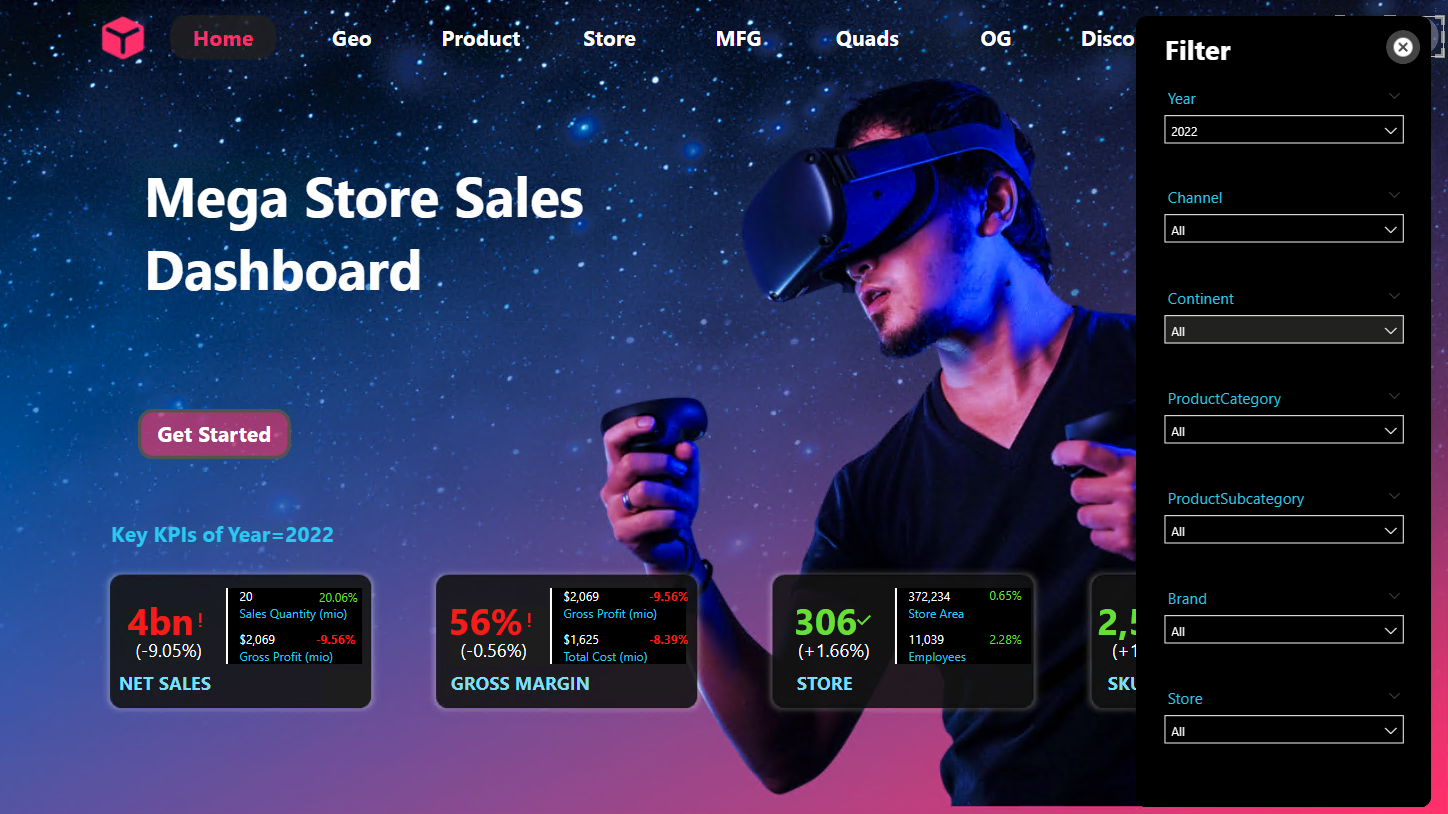
Seven filters are hidden under the hamburger menu for space optimization. Clicking on the menu will reveal the Filter panel on the right. Hitting the Close button to close the panel.
Selected dimensions are presented next to the line Key KPIs. For instance, since 2022 is selected, hence Key KPIs of Year=2022.
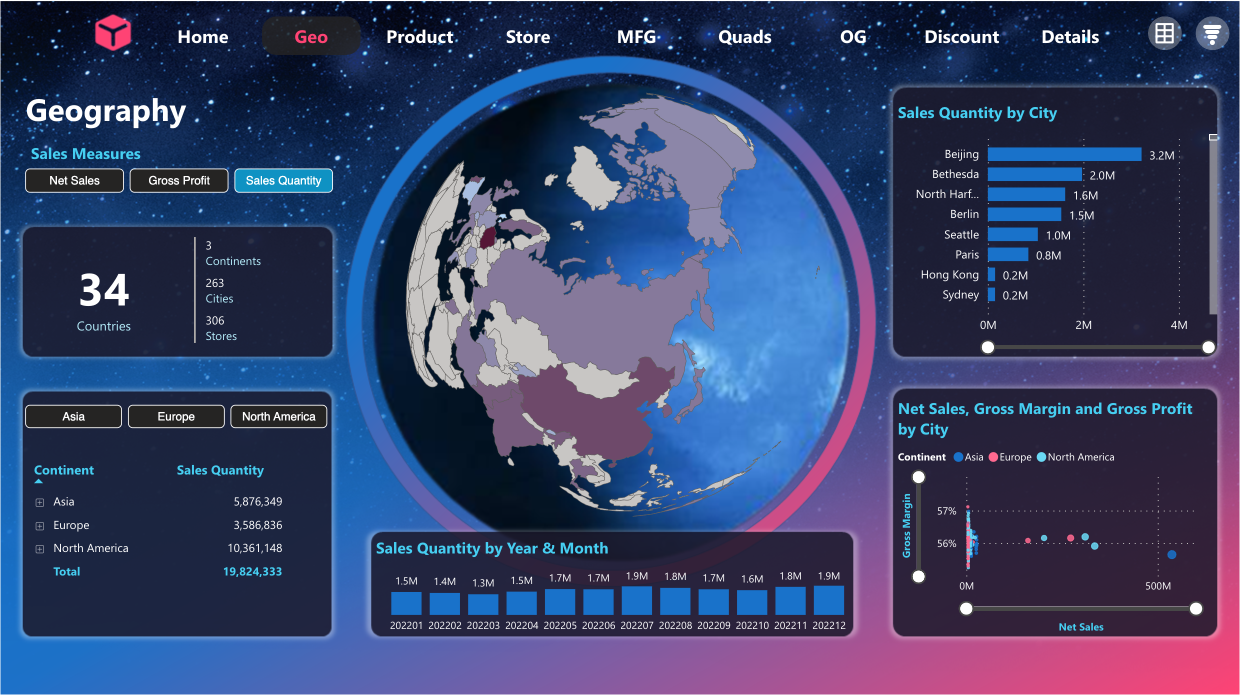
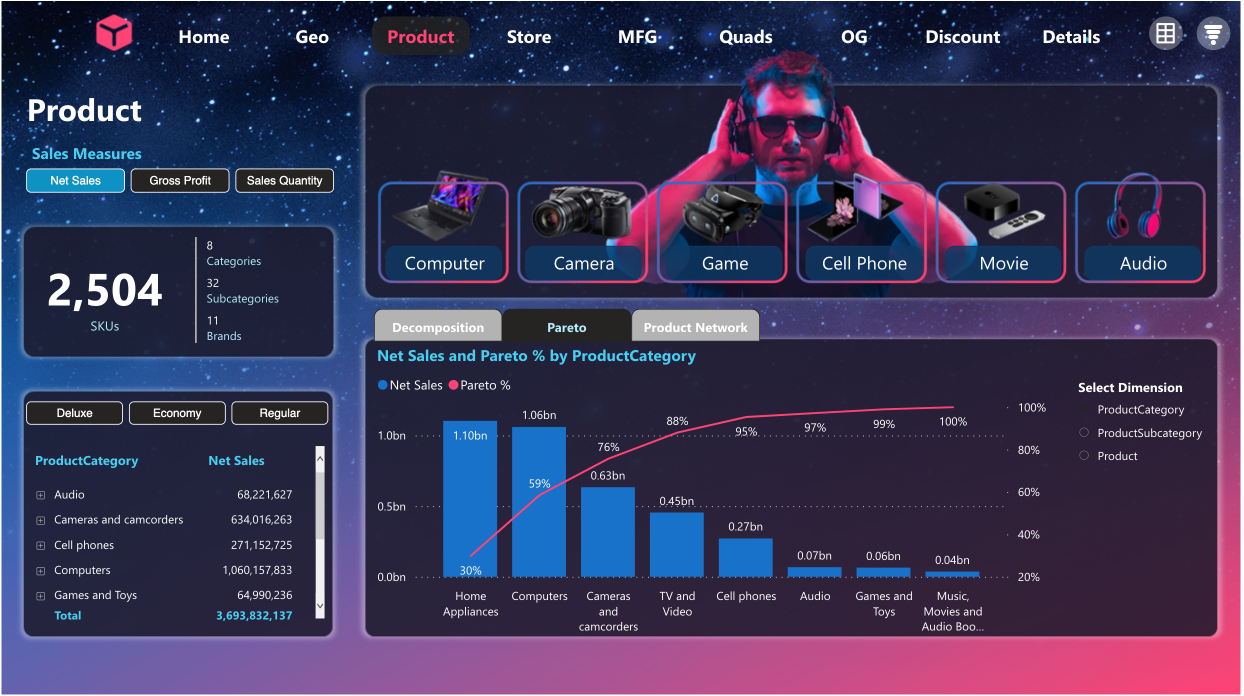
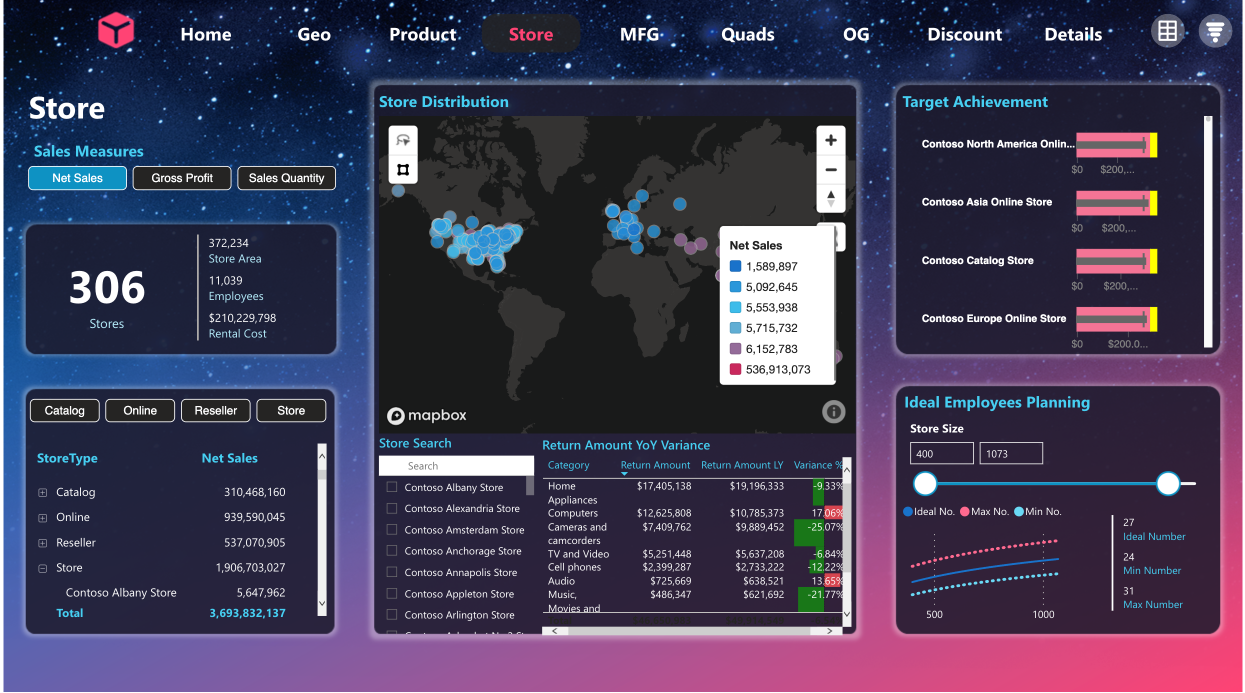
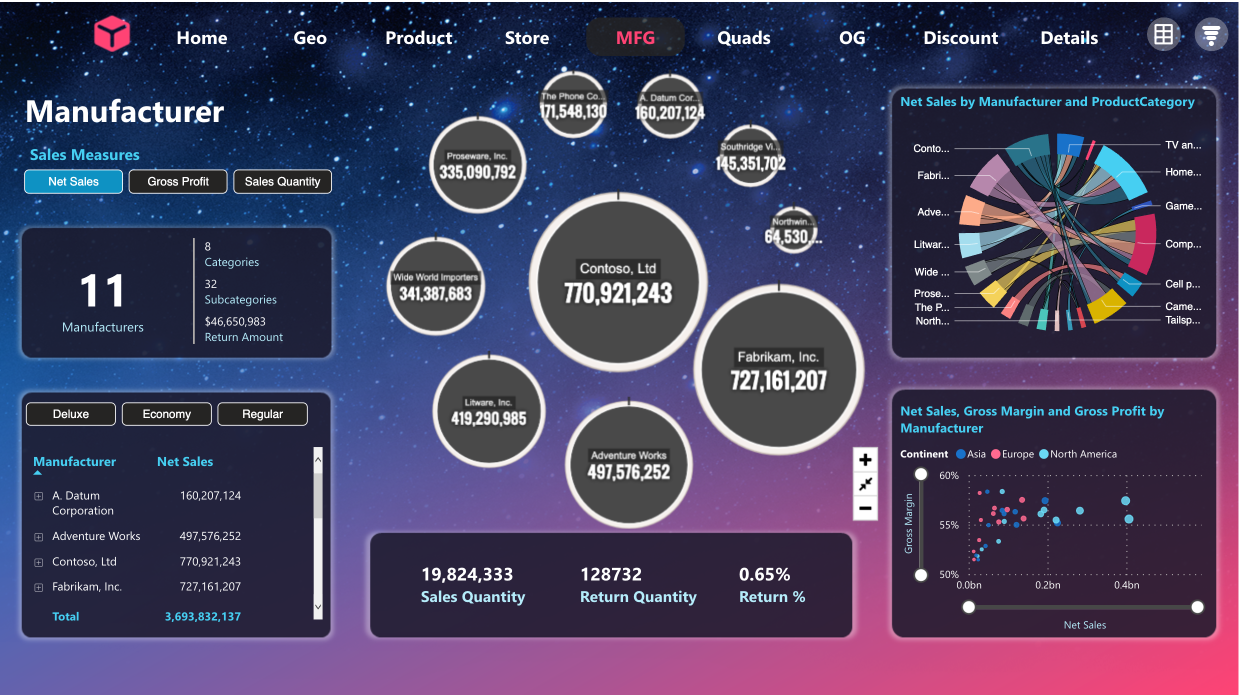
Basic analysis examines three dimensions of a retail operating model: products, people, stores, and a 360 degree view of sales and profit KPIs.
In-depth analysis employs four-quadrant analysis, organic growth analysis and discount analysis, presented in dashboards.
Eyes and narratives follow the flow from KPI display (left) to primary analysis (middle) and secondary analysis (right).
Credits
Credit acknowledgement to those whose property I used in this article:
Cover picture by Florian Olivo
Icon picture by Mary Amato