Merchandise Store
E-commerce: Google Merchandise Store
Overview
It is the dream of every business to accurately measure ROI of every activity and dollar spent. The introduction of digital marketing makes it one step closer. Business owners can quickly grasp an overall idea of how their business is doing with the support of Google Analytics - something that traditional offline business can hardly achieve.
Google Analytics dashboard is a good starting point to monitor daily performance. However, the CMO, the sales & marketing team always want to know more. They may want to break the KPIs into a more granular level, alter the way a current KPI is defined, create new KPIs, or they may wish to augment GA data with other data sources and conduct analysis on-premise outside the Google environment. In such a case, Google Analytics dashboard won’t meet their needs because Google Analytics presented at summary level. Therefore, it’s vital to obtain the granular raw data that Google Analytics collected, and do on-demand, customized analysis in-house.
The objective of this project is to analyze consumer digital footprint across channels, devices, sources, mediums, and answer any burning questions from CMO and the marketing team: Where the traffic comes from and how it converts? Of all the digital marketing tactics, what works and what doesn’t?
This project uses the one year data of Google Merchandise Store, an e-commerce site that sells Google branded products, to get the hit-level raw data then re-create key metrics. Access to BigQuery script can be found here.
Building Data Pipeline
Google Cloud Platform > BigQuery > Tableau Public
The original dataset contains 366 tables from 2016-08-01 to 2017-08-01. It has close to one million records and is more than 5GB in size.
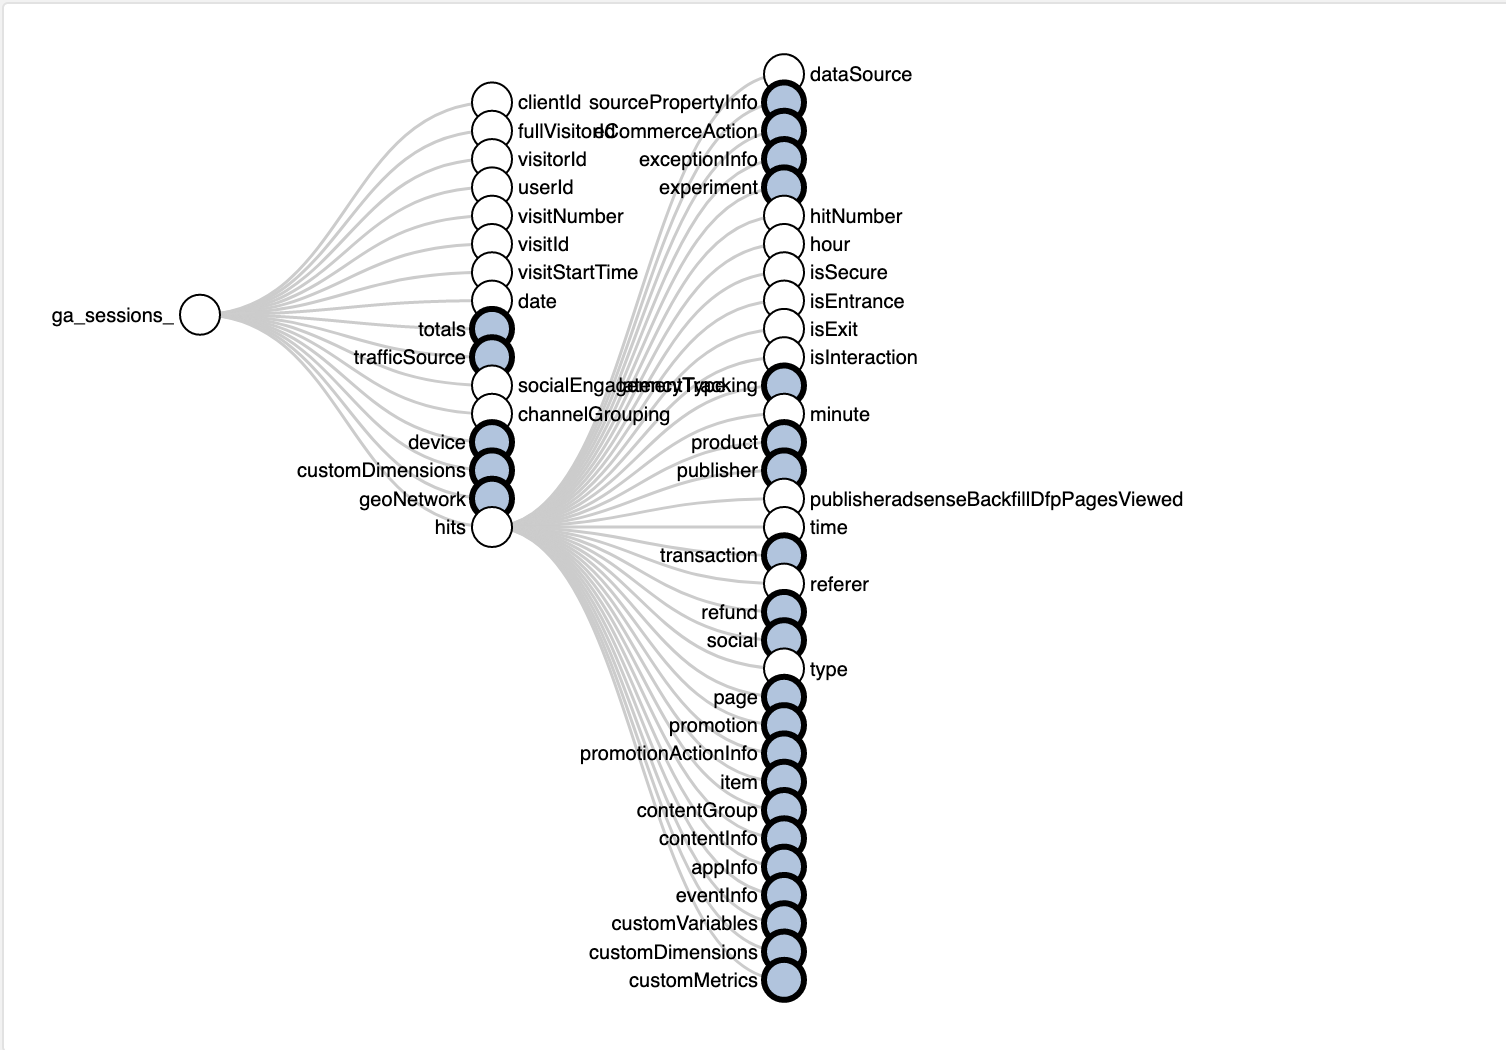
For the sake of those who are not familiar with Google Analytics (GA) data schema, GA stores data in three levels: user, session, and hit.
User: visitor/device that initiated one session within a website or app within a specific period of time.
Session: a user’s group of interactions with the website that takes place within a limited time frame. An session ends when a visitor is idle for more than 30 minutes.
Hit: An interaction that website owners decide to be worth collecting, hence being sent to GA. For instance, a hit can be a page view, an app/screen view, or a transaction.
Google Analytics Data Scheme. Source: https://storage.googleapis.com/e-nor/visualizations/bigquery/ga360-schema.html
I wrote the SQL queries script in BigQuery console to transform the original data into the ready-to-use format for Tableau.
Queries do the following: (1) unnest the original tables to get hit-level data, (2) collect metrics of interests: sessions, page views, unique page views, time on page, exit, bounces, and (3) join six tables that contain the metrics to get one table for visualization.
The dataset after transformation is as below.
Defining KPIs
Below is definition of 11 base Key Performance Indicators (KPIs).
1
2
3
4
5
6
7
8
9
10
11
Total Sessions = SUM ([sessions])
Total Bounces = SUM ([bounces])
Total Page views = SUM ([pageviews])
Total Unique Pageviews = SUM ([unique_pageviews])
Total Duration = SUM ([total_time_on_page_combined])
Total Exit = SUM ([exits])
Avg Unique Pageview = [Total Unique Pageviews] / [Total Sessions]
Avg Duration per Session = [Total Duration] / [Total Sessions]
Avg Time on Page = [Total Duration] / [Total Page views] - [Total Exit]
Bounce rate % = [Total Bounces] / [Total Sessions]
Exit rate% = [Total Exit] / [Total Pageviews]
Total Sessions, Avg Duration, Avg Unique Pageviews, and Sessions change % metrics are calculated on the basis of Month-over-month (MoM) and Year-over-year (YoY) analysis.
For those who are unfamiliar with these terms, MoM measures the changes of a given variable from one month to the next while YoY measures the changes with its numbers for the same month one year earlier.
Developing Dashboards
The report has two dashboards: overview and ad-hoc analysis.
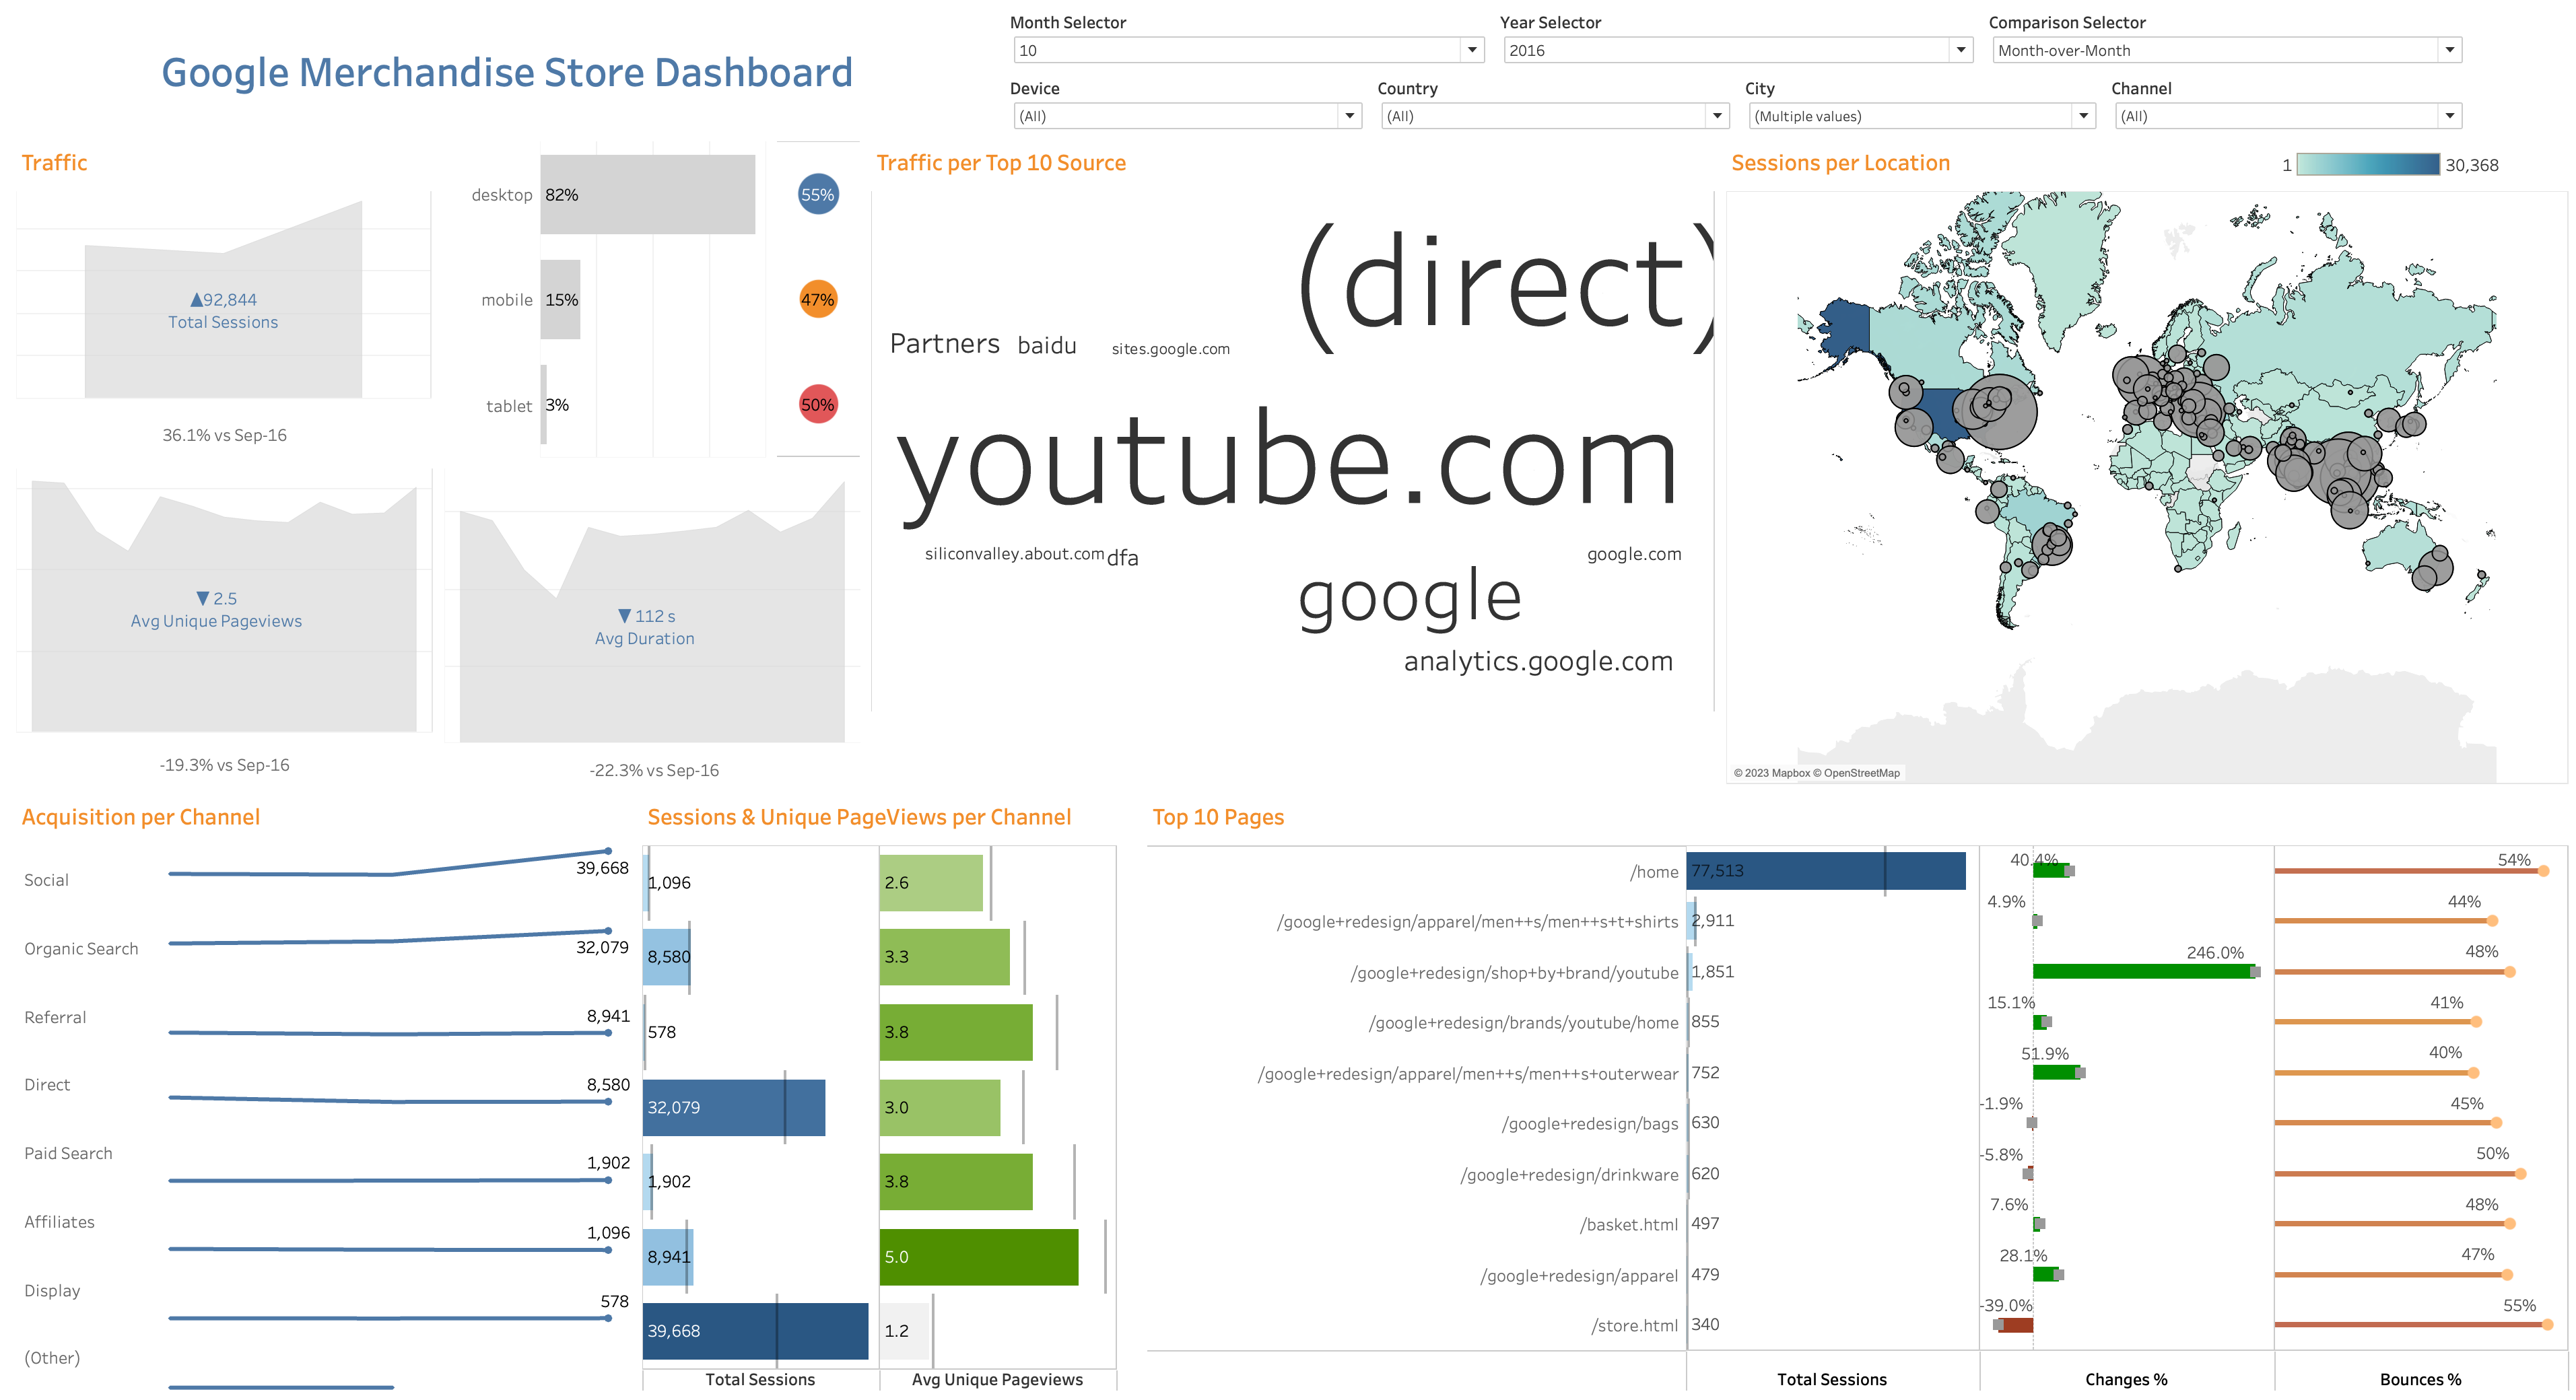
Overview dashboard shows where the traffic comes from per country, city, channel and device, as well as how well it converts per channel. It also presents relevant KPIs of unique page views and bounce rate.
The Month Selector and Year Selector parameters allow users to choose the month and year that represent the KPIs.
TheComparison Selector parameter allows users to choose whether they wish to use MoM or YoY analysis over the KPIs.
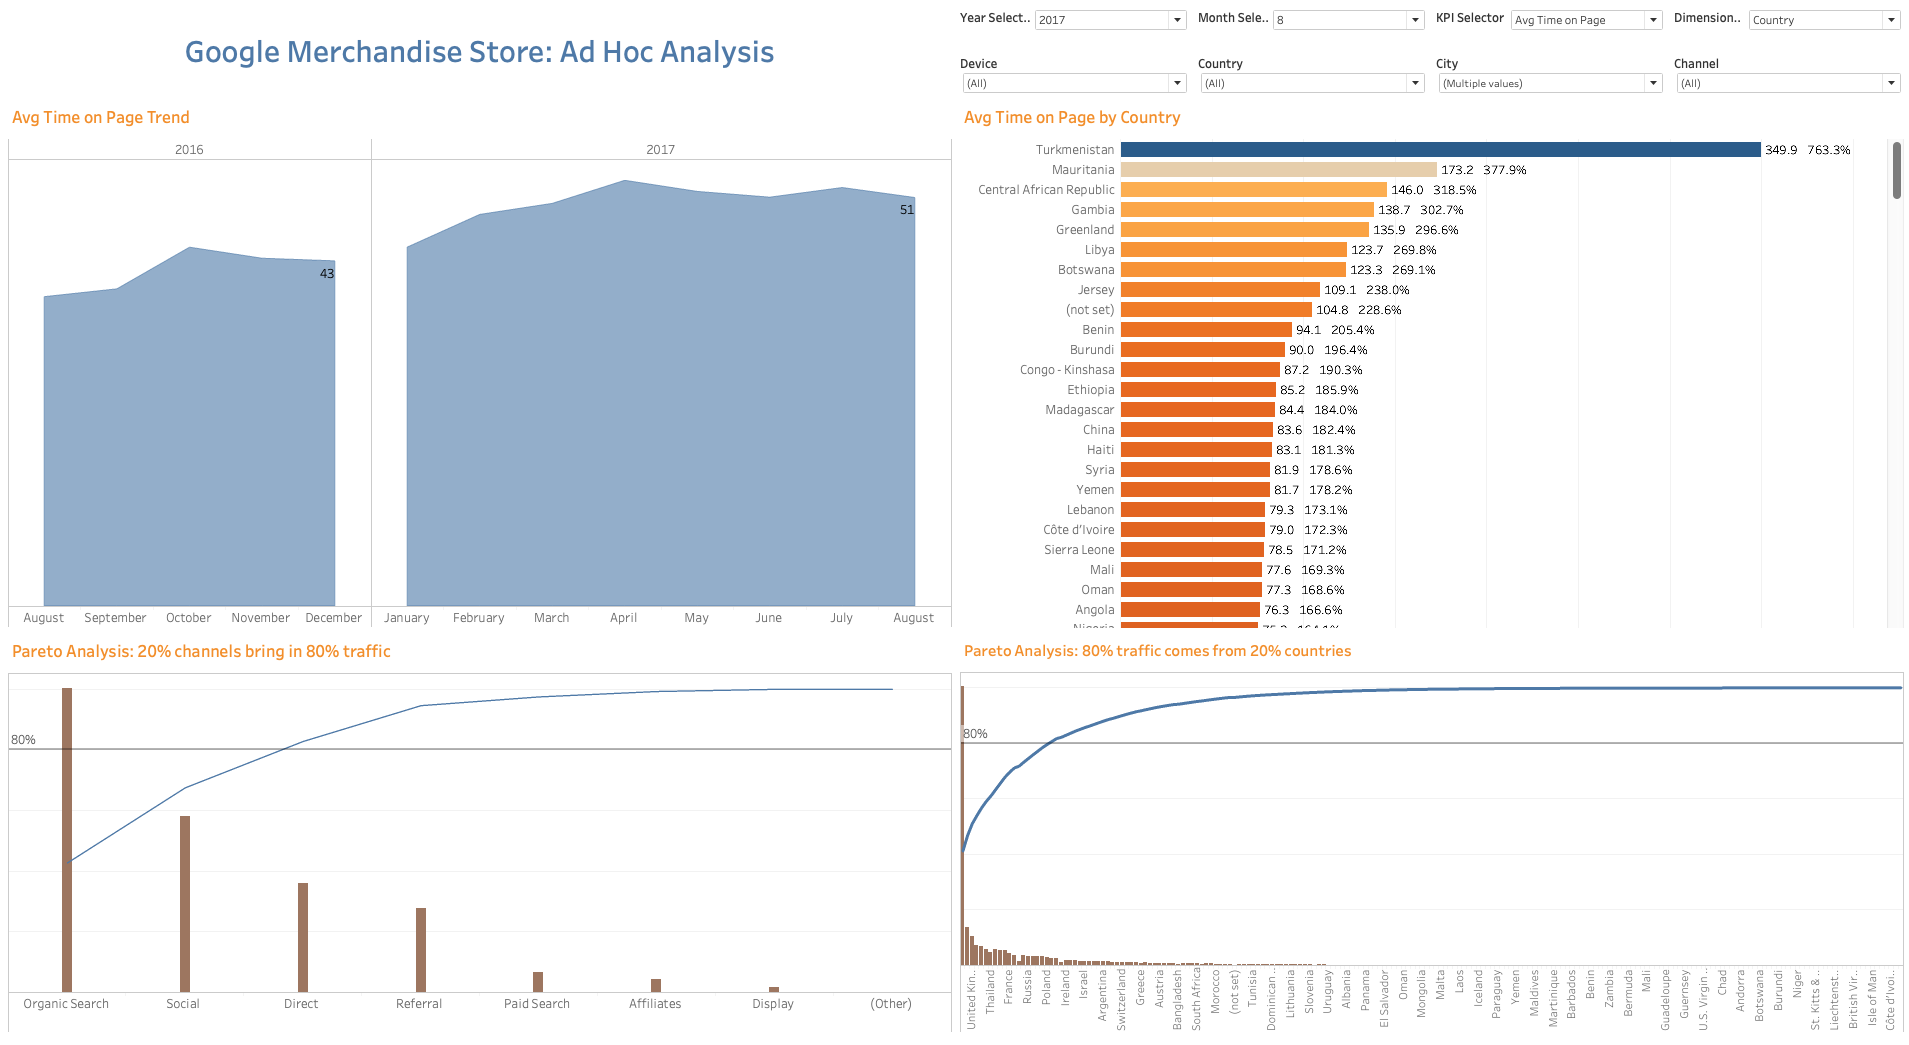
The ad-hoc analysis dashboard, as suggested by its name, supports ad-hoc inquiries of users by providing the trend of 8 KPIs users care the most, drilled down by four dimensions, country, city, device, and channel.
Users can use the KPI Selector and Dimensions Selector parameters to choose the KPIs and dimensions they want to display. Therefore the report and analysis are fully configurable.
The bottom part of the dashboard applies the Pareto’s 80/20 rule: ~ 80% traffic comes from ~20% countries and channels to answer the question of where, geographically speaking, and what marketing tactics works the best.
Key Results
Paid search in much less effective in generating traffic in comparison with organic search and social media. This is actually understandable and not surprising given the uniqueness of the business: selling products made by Google and its affiliates.
Yet, despite its low traffic generation, paid search ranked in the top 5 channels of acquisition. It’d require to combine the cost of paid search with the revenue those searches brought in to evaluate the ROI and decide if it’s a channel worth continued investment. I though suspect organic and social media would be a better choice, given higher leads generation and higher acquisition, if the company wants to prioritize or even cut costs.
The top 10 countries that had the highest average time on page didn’t make it to the top 10 of acquisition. So we have a group of customers spending time surfing the website, looking into products but haven’t yet taken a purchase. It seems these groups of customers come from countries that GMS doesn’t ship to. There could be a market expansion potential if demands are big enough.
Credits
Credit acknowledgement to those whose property I used in this article:
Cover picture by Campaign Creators
Icon picture by Mary Amato


